Xylem 19-001-350R2 PACE Integrated Pump Controller Human Machine Interface (HMI) for the Silent Storm VFD Pumping System – Technician Guide User Manual
Page 32
32
Web Reports Menu
After logging in, web reports menu is displayed
containing the following buttons, Login, Trend View,
Alarms Report, Historical Report, Usage Report,
Factory Report, Print Setup, Print, and Exit.
NOTE: Factory Report is available only to a
supervisor or technician. It includes a list of values
of various PLC registers and is not covered further
in this guide.
The banner at the top shows the current date and
time. Using this bar, alarm reports, usage reports
(in gallons), and several setup files in .xml format.
All reports can be printed. Use [Exit] to exit the
reports menu.
Figure 74: Web Reports Menu
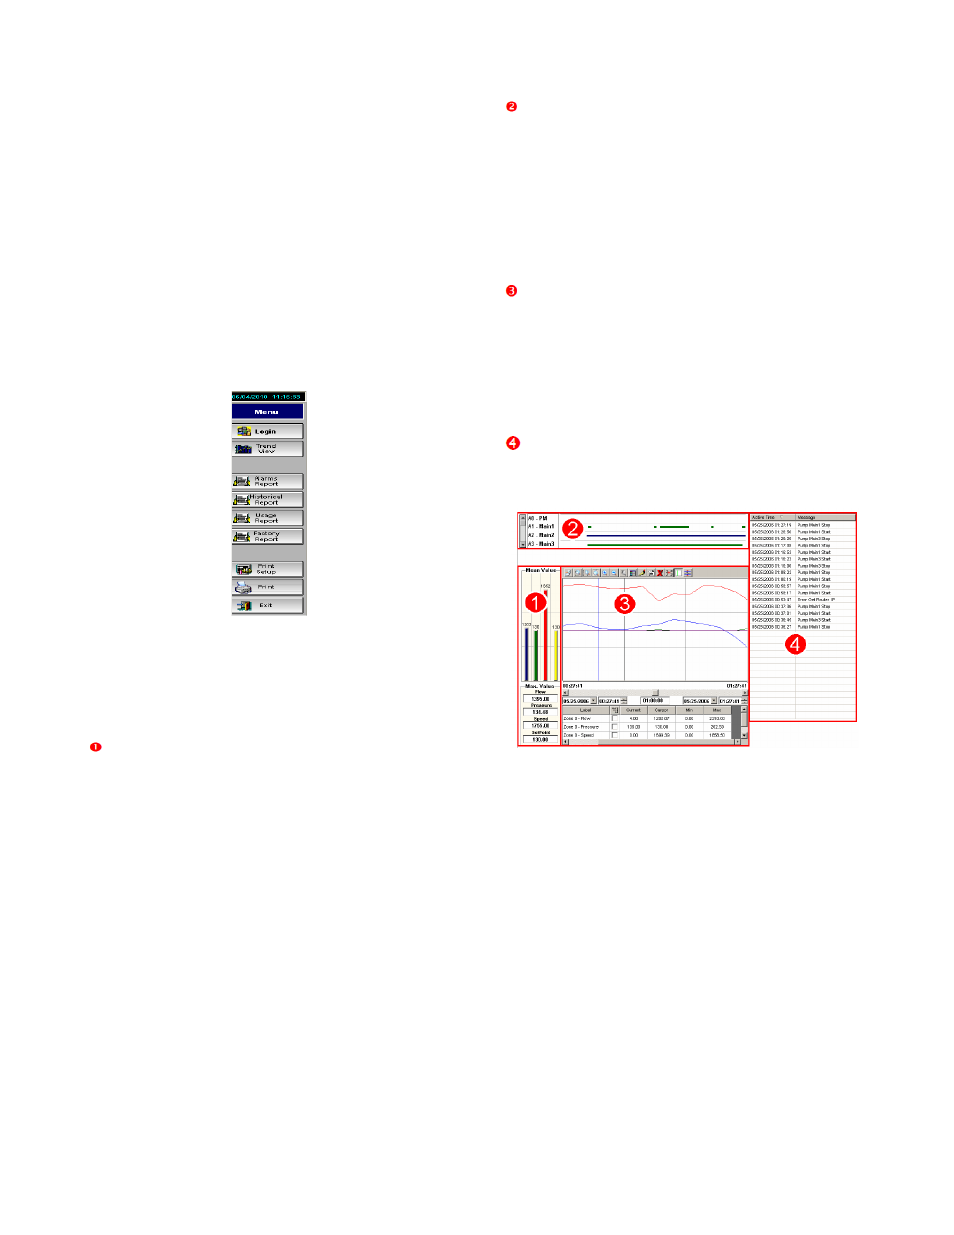
Trend View
Select [Trend View] from the Web Reports Menu.
There are four key parts to the trends screen.
Mean Value Graph and Detail: For each of the
key variables (Flow, Pressure, Speed, and
Setpoint) the mean values are displayed as a
vertical bar graph on the top while the Maximum
values are displayed in fields below.
Pump Run Log: Graphically displays the pump
operation for the time frame selected. These are
color coded:
•
Green - indicates pump is running
•
Blue - indicates pump is running on
VFD.
•
Red - indicates pump is in a fault
condition.
Variables Graph: Line graph displays color-
coded information for key variables over a specified
time. The top bar of the graph also has zoom,
period, and legend options. The grid below displays
variable data. Click […] to choose line colors.
Choose the start date, time and duration for the
graph from fields positioned between the graph and
grid.
Events Listing: Details the time and events for
a duration time defined by the user, as for the
variables graph.
Figure 75: Trends View
Alarms Report
Select [Alarms Report] from the Web Reports
Menu.
Alarms Report allows you to view the last 10
system alarms and events.