Typical performance characteristics (continued), Figure 17. esr vs. output current, Figure 18. esr vs. output current – Diodes AP2210 User Manual
Page 25
300mA RF ULDO REGULATOR AP2210
Data Sheet
25
Jan. 2012 Rev. 1. 6
BCD Semiconductor Manufacturing Limited
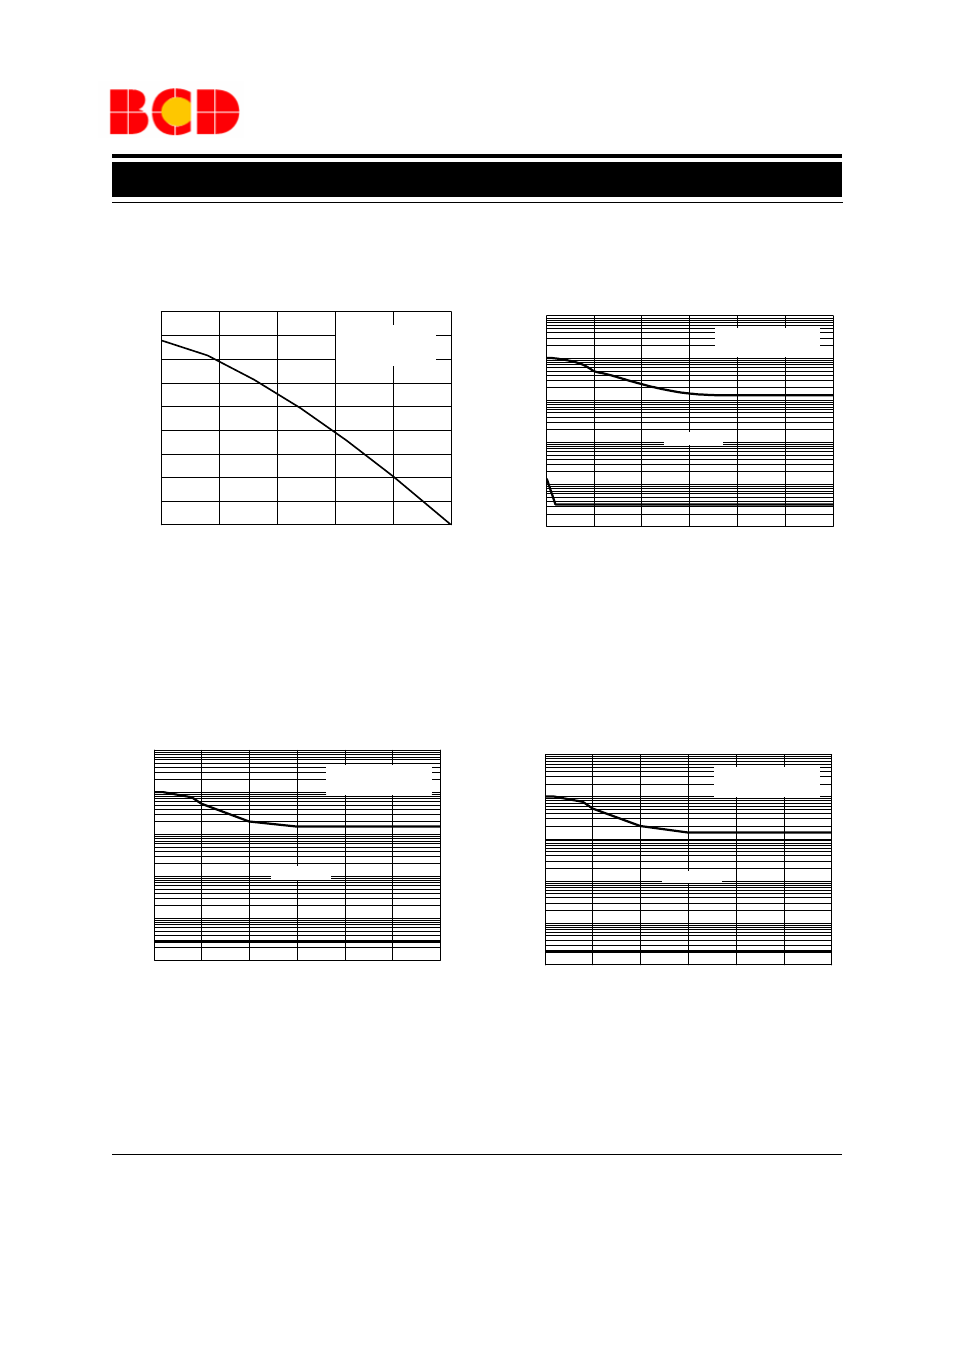
Typical Performance Characteristics (Continued)
Figure 17. ESR vs. Output Current
50
100
150
200
250
300
0.01
0.1
1
10
100
1000
ES
R
(
Ω
)
Output Current (mA)
C
OUT
=1
µ
F
No Bypass Capacitor
Stable Area
Figure 18. ESR vs. Output Current
50
100
150
200
250
300
0.01
0.1
1
10
100
1000
ES
R (
Ω
)
Output Current (mA)
C
OUT
=2.2
µ
F
No Bypass Capacitor
Stable Area
25
50
75
100
125
150
0.0
0.1
0.2
0.3
0.4
0.5
0.6
0.7
0.8
0.9
Power
Di
ss
ipat
ion (
W
)
Ambient Temperature (
o
C)
AP2210-3.0
SOT-23-5 Package
No Heatsink
Figure 16. Power Dissipation vs. Ambient Temperature
Figure 19. ESR vs. Output Current
50
100
150
200
250
300
0.01
0.1
1
10
100
1000
ES
R (
Ω
)
Output Current (mA)
C
OUT
=4.7
µ
F
No Bypass Capacitor
Stable Area
See also other documents in the category Diodes Hardware:
- PDS3200 (5 pages)
- PDS340 (5 pages)
- PDS340Q (5 pages)
- PDS360 (5 pages)
- PDS360Q (5 pages)
- PDS4150 (4 pages)
- PDS3100Q (5 pages)
- PDS3100 (5 pages)
- PDS1240CTL (5 pages)
- PDS1045 (5 pages)
- PDS1040L (5 pages)
- PDS1040CTL (5 pages)
- PDS1040 (5 pages)
- PD3S230L (5 pages)
- PD3S230H (3 pages)
- PDS5100Q (5 pages)
- PDS835L (5 pages)
- PDS760 (5 pages)
- PDS560 (5 pages)
- PDS540 (5 pages)
- PDS5100H (5 pages)
- PDS5100 (5 pages)
- PDS4200H (6 pages)
- SBL3060CTP (4 pages)
- SBL30L30CT (3 pages)
- SBL3045CTP (4 pages)
- SBL3040CTP (4 pages)
- SBL2060CTP (4 pages)
- SBL2030CT - SBL2060CT (3 pages)
- SBL2045CTP (4 pages)
- SBL1060CTP (4 pages)
- SBL1040CTP (4 pages)
- SBG3030CT - SBG3045CT (5 pages)
- SB520 - SB560 (3 pages)
- SB370 - SB3100 (3 pages)
- SB320 - SB360 (3 pages)
- SBR10U100CT (5 pages)
- SBR10U150CT (5 pages)
- SBR10A45SP5 (5 pages)
- SBR1060CT (5 pages)
- SBR1045SP5 (5 pages)
- SBR1045SD1 (4 pages)
- SBR1045D1 (5 pages)
- SBR1045CTL (4 pages)
- SBR1040CT (5 pages)