Typical performance characteristics – Diodes TLV27x User Manual
Page 10
TLV271/ TLV272
Document number: DS35394 Rev. 4 - 2
10 of 17
December 2013
© Diodes Incorporated
NEW PROD
UC
T
TLV271/TLV272
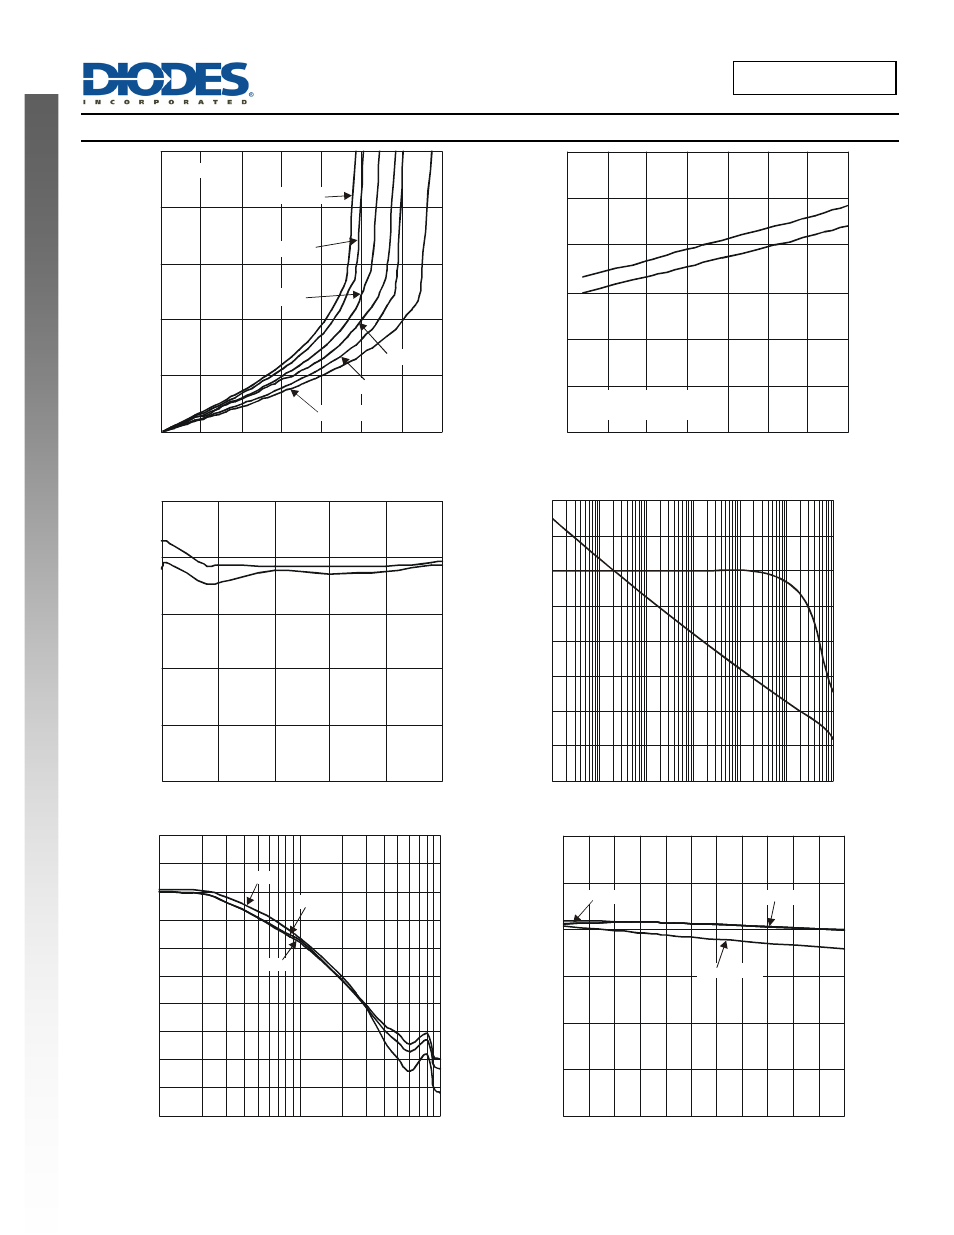
Typical Performance Characteristics
(cont.)
0.0
2.0
4.0
6.0
8.0
10.0
0
20
40
60
80
100
120
140
LOW-LEVEL OUTPUT CURRENT (mA)
Figure 13 Low-Level Output Voltage vs.
Low-Level Output Current
LO
W
-L
EVEL
O
U
T
P
U
T
V
O
LT
A
G
E (
V
)
V
= 10V
DD
T = +125 C
A
°
T = +105 C
A
°
T = +70 C
A
°
T = +25 C
A
°
T = 0 C
A
°
T = -40 C
A
°
0
0.5
1
1.5
2
2.5
3
-50
-25
0
25
50
75
100
125
TEMPERATURE (°C)
Figure 14 Slew Rate vs. Temperature
SL
EW
R
AT
E
(
V
/µ
s)
SR-
SR+
V
= 5V, A = 1, R = 10k,
C = 50pF, V
=V
/2
DD
V
L
L
O(PP)
DD
0
0.5
1
1.5
2
2.5
2.5
5
7.5
10
12.5
15
SUPPLY VOLTAGE (V)
Figure 15 Slew Rate vs. Supply Voltage
SL
E
W
R
A
T
E (
V
/µ
s)
SR-
SR+
FREQUENCY (Hz)
Figure 16 Differential Voltage Gain and Phase vs. Frequency
-40
-20
0
20
40
60
80
100
120
10
1000
100000
10000000
AV
D
-
D
IF
F
E
R
E
N
T
IA
L V
O
LT
A
G
E
G
AI
N
(dB
)
-180
-135
-90
-45
0
45
90
135
180
P
H
A
S
E
(°
)
C , CAPACITIVE LOAD (pF)
Figure 17 Phase Margin vs. Capacitive Load
L
0
10
20
30
40
50
60
70
80
90
100
10
100
1000
P
H
A
S
E
M
A
R
GIN
(°)
0
Ω
50
Ω
100
Ω
0.0
0.5
1.0
1.5
2.0
2.5
3.0
-40 -25 -10 5
20 35 50 65 80 95 110 125
T , FREE-AIR TEMPERATURE (°C)
Figure 18 Gain Bandwidth Product vs. Free Air Temperature
A
G
BM
P
-G
AI
N
BANDW
ID
T
H
P
R
O
D
U
C
T
(M
H
z)
V
= 5V
DD
±
V
= 2.5V
DD
±
V
= 1.35V
DD
±