Varistor products, Radial leaded varistors > lv ultramov, Series – Littelfuse LV UltraMOV Varistor Series User Manual
Page 3: Lv ultramo v
© 2014 Littelfuse, Inc.
87
Revised: January 16, 2014
Varistor Products
LV UltraMOV
TM
Series
Radial Leaded Varistors > LV UltraMOV
TM
Series
Specifications are subject to change without notice.
Please refer to www.littelfuse.com for current information.
LV UltraMO
V
™
S
eries
Current Energy and Power Dissipation Ratings
100
90
80
70
60
50
40
30
20
10
0
-55
50
60
70
80
90
100 110
120 130 140 150
AMBIENT TEMPERATURE (
o
C)
PERCENT OF
RA
TED
VALUE
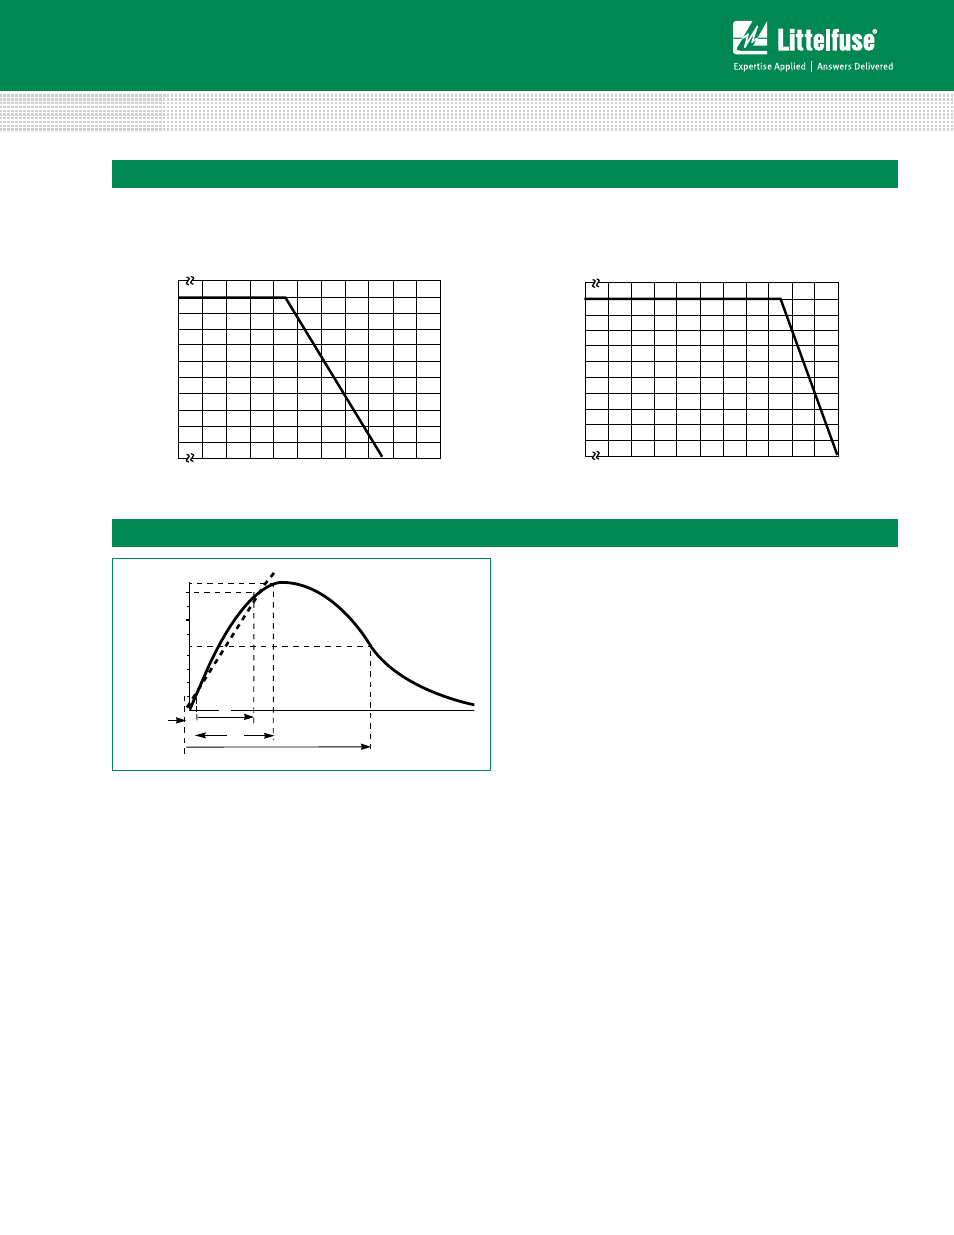
FIGURE 1. CURRENT, ENERGY AND POWER DERATING
CURVE
Figure 1A - Power Derating for Epoxy Coated
FIGURE 1. CURRENT, ENERGY AND POWER DERATING
CURVE
100
90
80
70
60
50
40
30
20
10
0
-55
50
60
70
80
90
100 110 120 130 140 150
AMBIENT TEMPERATURE (
o
C)
PERCENT OF
RA
TED
VALUE
Figure 1B - Power Derating for Phenolic Coated
T
1
T
2
100
50
0
O
1
TIME
PERCENT OF PEAK
VALUE
O
1
= VIRTUAL ORIGIN OF WAVE
t
1
= VIRTUAL FRONT TIME = 1.25 x t
(IMPULSE DURATION)
t = TIME FROM 10% TO 90% OF PEAK
t
2
= VIRTUAL TIME TO HALF VALUE
EXAMPLE:
FOR AN 8/20 s CURRENT WAVEFORM
8 s = t
1
= VIRTUAL FRONT TIME
20 s = t
2
= VIRTUAL TIME TO
HALF VALUE
FIGURE 2. PEAK PULSE CURRENT TEST WAVEFORM
FOR CLAMPING VOLTAGE
T
Peak Pulse Current Test Waveform for Clamping Voltage
0
1
= Virtual Origin of Wave
T = Time from 10% to 90% of Peak
T
1
= Rise Time = 1.25 x T
T
2
= Decay Time
Example - For an 8/20
µs Current Waveform:
8µs = T
1
= Rise Time
20µs = T
2
= Decay Time
Figure 2
For applications exceeding 85ºC ambient temperature,
the peak surge current and energy ratings must be
reduced as shown below.
For applications exceeding 125ºC ambient temperature,
the peak surge current and energy ratings must be
reduced as shown below.