Transient voltage suppression diodes, Surface mount – 200w > smf series, Ratings and characteristic curves – Littelfuse SMF Series User Manual
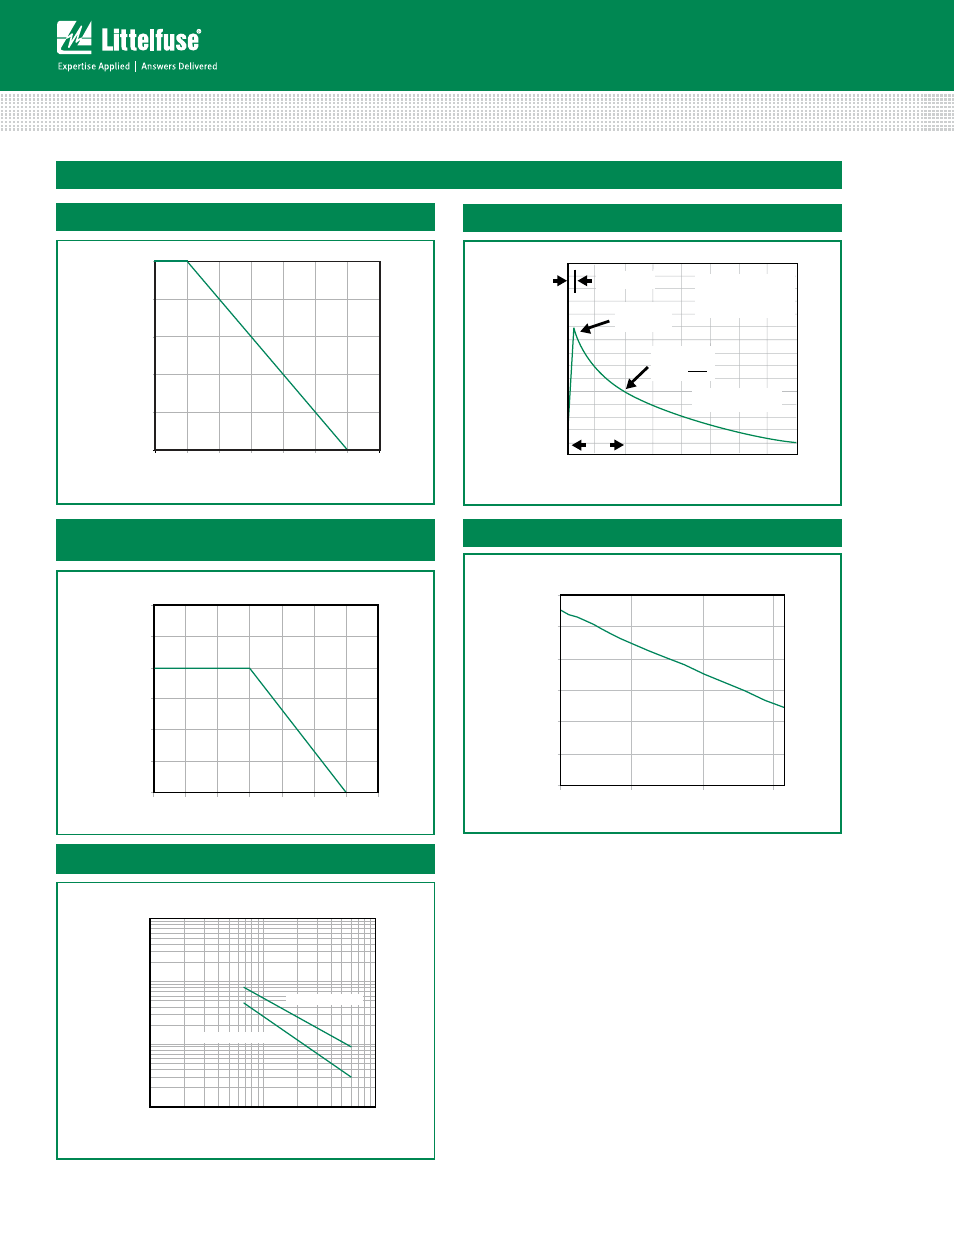
Page 4: Figure 6 - forward voltage, Figure 3 - pulse derating curve, Figure 7 - c, Vs. working peak reverse voltage
Transient Voltage Suppression Diodes
© 2014 Littelfuse, Inc.
Specifications are subject to change without notice.
Revised: 01/20/14
Surface Mount – 200W > SMF Series
Ratings and Characteristic Curves
(T
A
=25°C unless otherwise noted)
(Continued)
0
0.4
0.5
0.6
0.7
0.8
0.9
-55
10
75
140
Temperature (ºC)
V
f
- Typical forward dropped voltage
Figure 6 - Forward Voltage
0
20
40
60
80
100
0
25
50
75
100
125
150
175
T
A
-Ambient temperature (ºC)
Peak Pulse Power (P
PP
) or Current (I
PP
)
Derating in Percentage
%
Figure 3 - Pulse Derating Curve
I
PPM
- P
eak P
ulse Cur
rent, %
I
RSM
0
0
50
100
150
1.0
2.0
3.0
4.0
tr=10µsec
Peak Value
IPPM
IPPM
2
TJ=25°C
Pulse Width(td) is defined
as the point where the peak
current decays to 50% of IPPM
10/1000µsec. Waveform
as defined by R.E.A
td
t-Time (ms)
Half Value
IPPM
( )
Figure 4 - Pulse Waveform - 10/1000
µ
S
0
0.25
0.50
0.75
1.00
1.25
1.50
0
25
50
75
100
125
150
175
P
M(A
V)
, Steady State Power Dissipation (W
)
T
L
- Tab temperature (ºC)
Figure 5 - Steady State Power Dissipation
Derating Curve
10
100
1000
10000
1
10
100
V
br
- Reverse breakdown voltage
C
j
(pf)
Measured@50%Vr
Measured@Vr=0v
Figure 7 - C
j
vs. Working Peak Reverse Voltage