Varistor products, 34s series, Hi–en e rgy mo v’s – Littelfuse TMOV 34S Varistor Series User Manual
Page 5: Tmov, 34s s eries pulse rating curve, V–i characteristic curves for tmov, 34s varistor, Series tmov
© 2013 Littelfuse, Inc.
227
Revised: December 16, 2013
Varistor Products
TMOV
®
34S Varistor Series
Industrial High Energy Thermally Protected Varistors > TMOV
®
34S Series
Specifications are subject to change without notice.
Please refer to www.littelfuse.com/series/tmov34s.html for current information.
Hi–En
E
rgy Mo
V’s
TMOV
®
34S S
eries
Pulse Rating Curve
FIGURE 6. SURGE CURRENT RATING CURVES FOR
HB34, HF34 and HG34
Hx34
50,000
20,000
10,000
5,000
2,000
1,000
500
200
100
50
20
10
20
100
1,000
10,000
SUR
GE CURRENT (A)
IMPULSE DURATION ( µs)
15
1
INDEFINITE
105
102
2
103
104
106
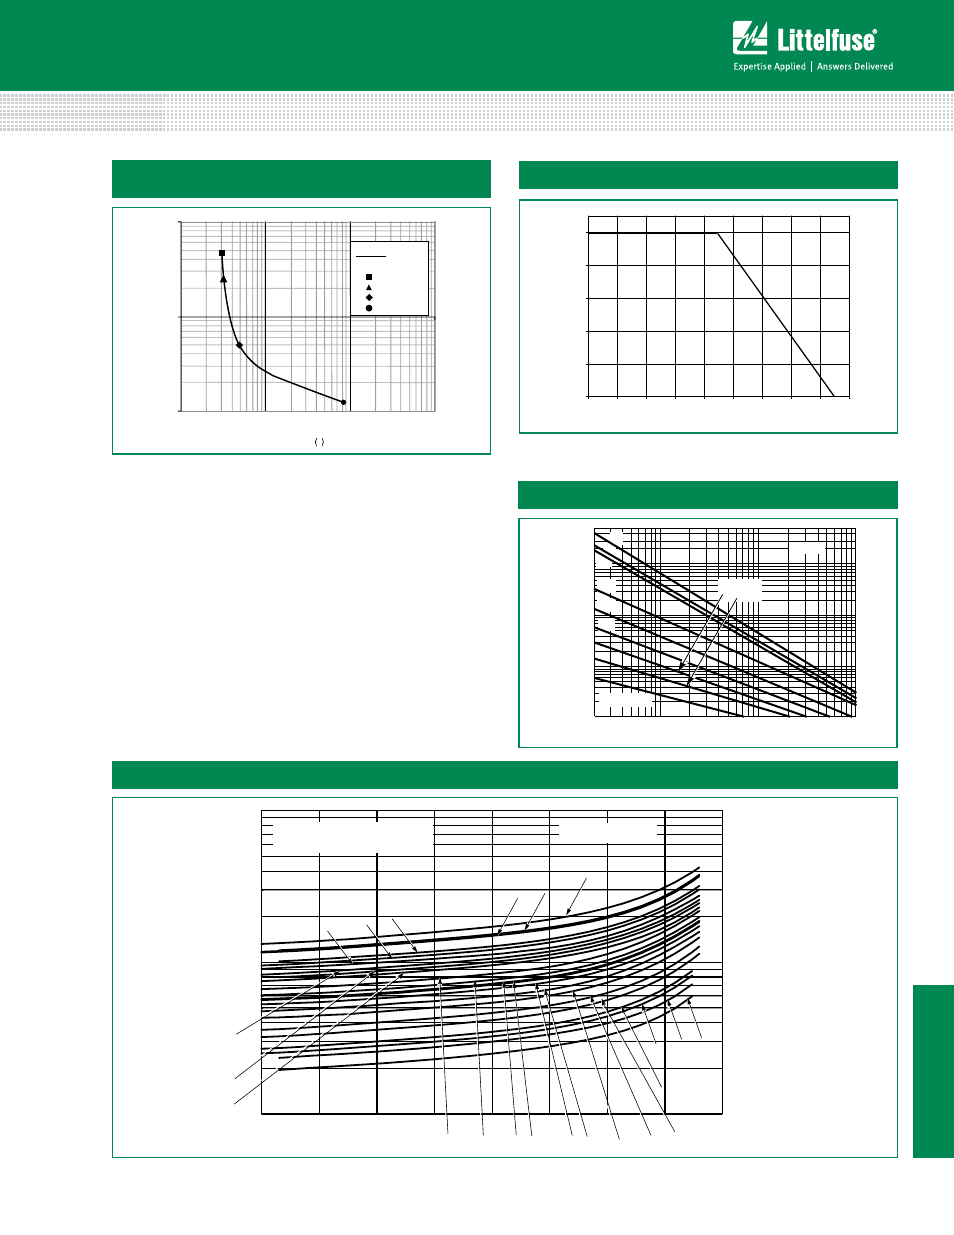
Peak Current & Energy Derating Curve
Typical time to open circuit under UL1449 Abnormal
Overvoltage Limited Current Test
* Figure 4: Typical time to open circuit under UL1449
Abnormal Overvoltage Limited Current Test
0.1
1
10
10
100
1000
10000
Time s
0.125A
0.5A
2.5A
5A
Typical
V–I Characteristic Curves for TMOV
®
34S Varistor
1000
10000
1mA
10mA
100mA
1A
10A
100A
10000A
100000A
TA = -55 C to 85C
V751
V681
V661
V571
V551
V511
V391
V351 V331 V321
V271
V251 V201 V181
V151
V141
V111
V131
V301
V481
V461
V421
100
1000A
Maximum Clamping Voltage
TMOV34S series
Current - AMPS
Voltage -
VOLTS
Note: The Industrial TMOV
®
Series TMOV
®
34S devices
are intended, in conjunction with appropriate enclosure
design, to help facilitate SPD module compliance to
UL 1449, Section 37.4 (Abnormal Overvoltage Limited
Current Requirements). Under these extreme abnormal
overvoltage conditions, the units will exhibit substantial
heating and potential venting prior to opening. Modules
should be designed to contain this possibility. Application
testing is strongly recommended.
For applications exceeding 85ºC ambient temperature, the peak
surge current and energy ratings must be reduced as shown.
For applications exceeding 85˚C ambient
temperature, the peak surge current and energy
ratings must be reduced as shown in Figure 5.
Figure 5: Peak Current & Energy Derating Curve
0
20
40
60
80
100
-55
50
60
70
80
90
100
110
120
130
AMBIENT TEMPERATURE (ºC)
PERCENT OF RATED VALU
E
Figure 1
Figure 2
Figure 3
Figure 4