Varistor products, Surface mount varistors > ch series, Ch series – Littelfuse CH Varistor Series User Manual
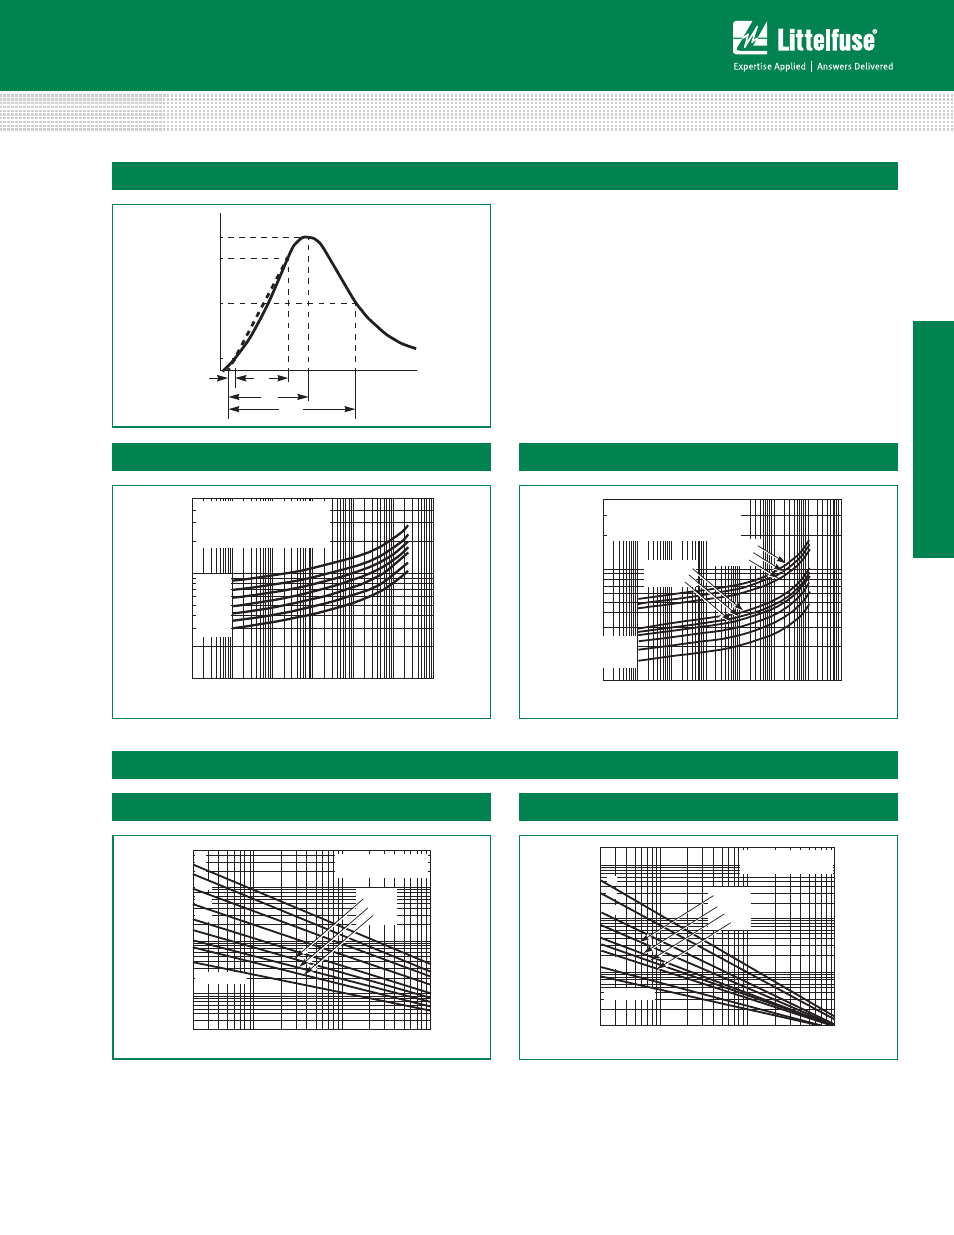
Page 3: Pulse rating curves, Rise time = 1.25 x t t, Rise time 20 μ s = t, Decay time
© 2013 Littelfuse, Inc.
71
Revised: May 8, 2013
Varistor Products
CH Varistor Series
Surface Mount Varistors > CH Series
Specifications are subject to change without notice.
Please refer to www.littelfuse.com/series/CH.html for current information.
CH Series
100
90
50
10
O
1
T
T
1
T
2
TIME
PERCENT OF PEAK V
ALUE
Peak Pulse Current Test Waveform
Clamping Voltage for V120CH8 – V430CH8
Clamping Voltage for V22CH8 – V68CH8
500
400
300
200
100
90
80
70
60
50
40
30
20
10
MAXIMUM PEAK
V
O
L
TS (V)
PEAK AMPERES (A)
10
-3
10
-2
10
-1
10
0
10
1
10
2
10
3
V56CH8
V47CH8
V39CH8
V33CH8
V27CH8
V22CH8
MAXIMUM CLAMPING VOLTAGE
MODEL SIZE 5 x 8mm
22 TO 56V
N(DC)
RATING
T
A
= -55
o
C TO 125
o
C
V68CH8
4,000
3,000
2,000
1,000
900
800
700
600
500
400
300
200
100
10
-3
10
-2
10
-1
10
0
10
1
10
2
10
3
10
4
V180CH8
V150CH8
V120CH8
V430CH8
V390CH8
V360CH8
V240CH8
V220CH8
V200CH8
PEAK AMPERES (A)
MAXIMUM PEAK
V
O
L
TS (V)
MAXIMUM CLAMPING VOLTAGE
MODEL SIZE 5 x 8mm
100 TO 430V
N(DC)
RATING
T
A
= -55
o
C TO 125
o
C
NOTE: If pulse ratings are exceeded, a shift of V
N(DC)
(at specified current) of more than +/-10% could result. This type of shift, which normally results in a decrease of V
N(DC)
, may result in
the device not meeting the original published specifications, but it does not prevent the device from continuing to function, and to provide ample protection.
Surge Current Rating Curves for V22CH8 - V56CH8
500
200
50
20
10
5
2
1
0.2
0.5
100
20
100
1,000
10,000
IMPULSE DURATION
SURGE CURRENT (A)
1
2
10
10
2
10
3
10
4
10
5
10
6
INDEFINITE
MODEL SIZE 5 x 8mm
V22CH8 - V56CH8
(μs)
20
100
1,000
10,000
IMPULSE DURATION
2,000
1,000
500
200
100
50
20
10
5
2
1
1
2
10
10
2
10
3
10
4
10
5
INDEFINITE
MODEL SIZE 5 x 8mm
V120CH8 - V430CH8
10
6
SURGE CURRENT (A)
(μs)
Pulse Rating Curves
0
1
= Virtual Origin of Wave
T = Time from 10% to 90% of Peak
T
1
= Rise Time = 1.25 x T
T
2
= Decay Time
Example:
For an 8/20 μs Current Waveform:
8μs = T
1
= Rise Time
20μs = T
2
= Decay Time
Surge Current Rating Curves for V120CH8 - V430CH8
Figure 2
Figure 3
Figure 4
Figure 5
Figure 6