Sidactor, Protection thyristors, Broadband optimized – Littelfuse SDP TwinChip Series 3x3 QFN User Manual
Page 3: Protection
SIDACtor
®
Protection Thyristors
42
Revised: February 22, 2011
© 2011 Littelfuse, Inc.
Specifications are subject to change without notice.
Please refer to www.littelfuse.com for current information.
Broadband Optimized
™
Protection
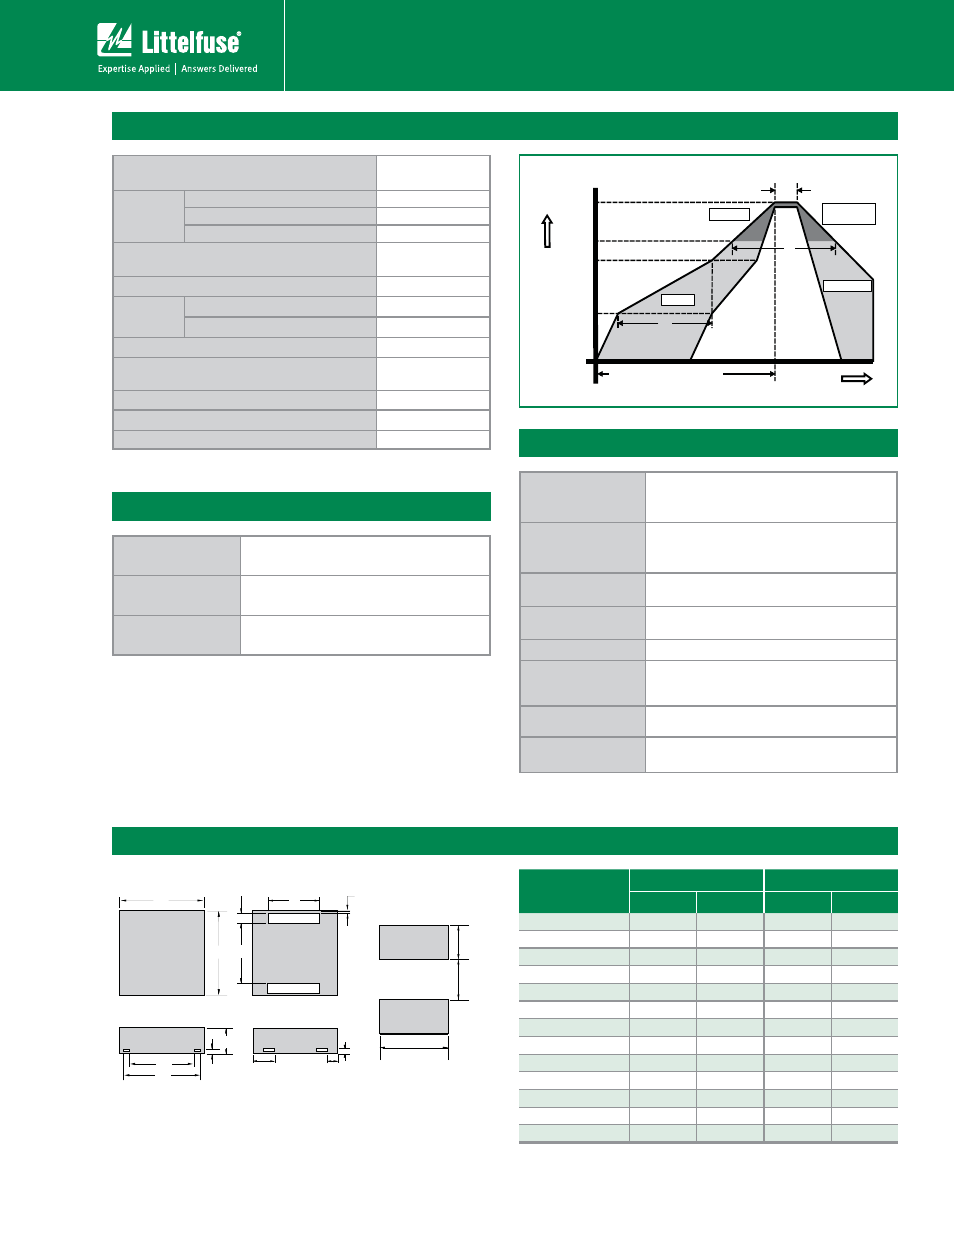
Soldering Parameters
Reflow Condition
Pb-Free assembly
(see Fig. 1)
Pre Heat
- Temperature Min (T
s(min)
)
¡$
- Temperature Max (T
s(max)
)
¡$
- Time (Min to Max) (t
s
)
60-180 secs.
Average ramp up rate (Liquidus Temp (T
L
)
to peak)
3°C/sec. Max.
T
S(max)
to T
L
- Ramp-up Rate
3°C/sec. Max.
Reflow
- Temperature (T
L
) (Liquidus)
¡$
- Temperature (t
L
)
60-150 secs.
Peak Temp (T
P
)
¡$
Time within 5°C of actual Peak Temp (t
p
)
30 secs. Max.
Ramp-down Rate
6°C/sec. Max.
Time 25°C to Peak Temp (T
P
)
8 min. Max.
Do not exceed
¡$
Physical Specifications
Environmental Specifications
Lead Material
Copper Alloy
Terminal Finish
100% Matte-Tin Plated
Body Material
UL recognized epoxy meeting flammability
classification 94V-0
High Temp Voltage
Blocking
80% Rated V
DRM
(V
AC
Peak
¡$PS¡$
504 or 1008 hrs. MIL-STD-750 (Method 1040)
JEDEC, JESD22-A-101
Temp Cycling
¡$UP¡$
NJOEXFMM
VQUP
cycles. MIL-STD-750 (Method 1051) EIA/JEDEC,
JESD22-A104
Biased Temp &
Humidity
52 V
DC
¡$3) VQUPIST&*"
JEDEC, JESD22-A-101
High Temp Storage
¡$IST.*-45% .FUIPE
JEDEC, JESD22-A-101
Low Temp Storage
-65°C, 1008 hrs.
Thermal Shock
¡$UP¡$
NJOEXFMM
TFDUSBOTGFS
10 cycles. MIL-STD-750 (Method 1056) JEDEC,
JESD22-A-106
Resistance to Solder
Heat
¡$ TFDT.*-45% .FUIPE
Moisture Sensitivity
Level
3)
¡$
IST
SFnPXDZDMFT
¡$1FBL+&%&$+45%
-FWFM
Dimensions — 3x3 QFN
2.54mm
0.100”
1.50mm
0.059”
1.27mm
0.050”
Recommended
solder pad layout
(Reference Only)
H
K1
N2
N1
END VIEW
SIDE VIEW
M2
M1
K2
F
E
C
J
B
A
TOP VIEW
BOTTOM VIEW
Dimensions
Inches
Millimeters
Min
Max
Min
Max
A
0.114
0.122
2.900
3.100
B
0.114
0.122
2.900
3.100
C
0.077
0.081
1.950
2.050
E
0.013
0.017
0.335
0.435
F
0.078
0.082
1.980
2.080
H
0.037
0.041
0.950
1.050
J
0.002
0.006
0.050
0.150
K1
0.006
0.001
0.150
0.250
K2
0.006
0.001
0.150
0.250
M1
0.028
0.031
0.700
0.800
M2
0.013
0.017
0.330
0.430
N1
0.097
0.101
2.470
2.570
N2
0.084
0.088
2.130
2.230
Time
Temper
at
ur
e
T
P
T
L
T
S(max)
T
S(min)
25
t
P
t
L
t
S
time to peak temperature
(t 25ºC to peak)
Ramp-down
Ramp-up
Preheat
Critical Zone
T
L
to T
P
Figure 1