Velleman WS2800 Software User’s Guide User Manual
Page 37
P a g e
| 37
WORKING WITH GRAPHS AND TEMPLATES
Now that we know how to create templates and graphs, let’s go over some of the things we can do with the data
that is displayed in our Chart window.
OPENING A GRAPH
To open a graph, select the Graph tab in the File Management window and double the filename. You can have
several graphs and templates open at one time, and each will have a tab across the top of the Chart window to
identify it.
IDENTIFYING THE CHART TYPE
Notice that template tabs
and graph tabs
each have their own unique icon to identify what
type of chart they represent.
MOVING THE CHART
You can slide the template or graph around in the chart window. To do this, click and hold the right mouse button
anywhere on the chart window. With the right mouse still held down, move the mouse and the chart will move
with it.
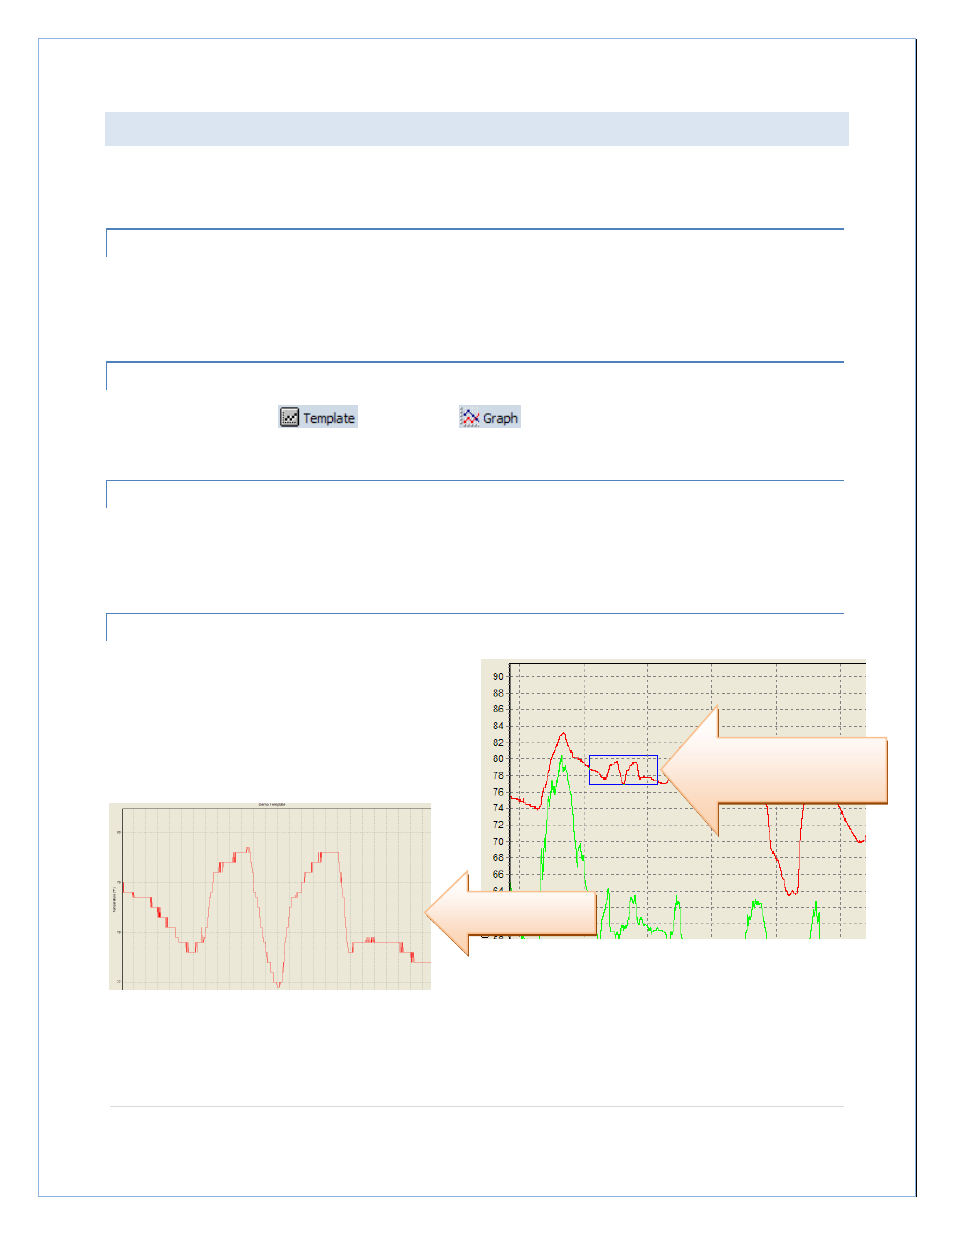
ZOOMING IN
To zoom in, move the mouse to a point on the chart
that is above and to the left of the area you want to
zoom in on. Press and hold the left mouse button and
move the mouse down and to the right, drawing a blue
box around the data you want to zoom in on.
When you release the mouse button, the chart will redraw the area you drew a box around at a zoom level that
fills the chart window with your data.
We want to zoom in on this area,
so we drew a box around it, from
upper left to lower right.
Here is our area of
interest, zoomed in.