Velleman WS2800 Software User’s Guide User Manual
Page 22
P a g e
| 22
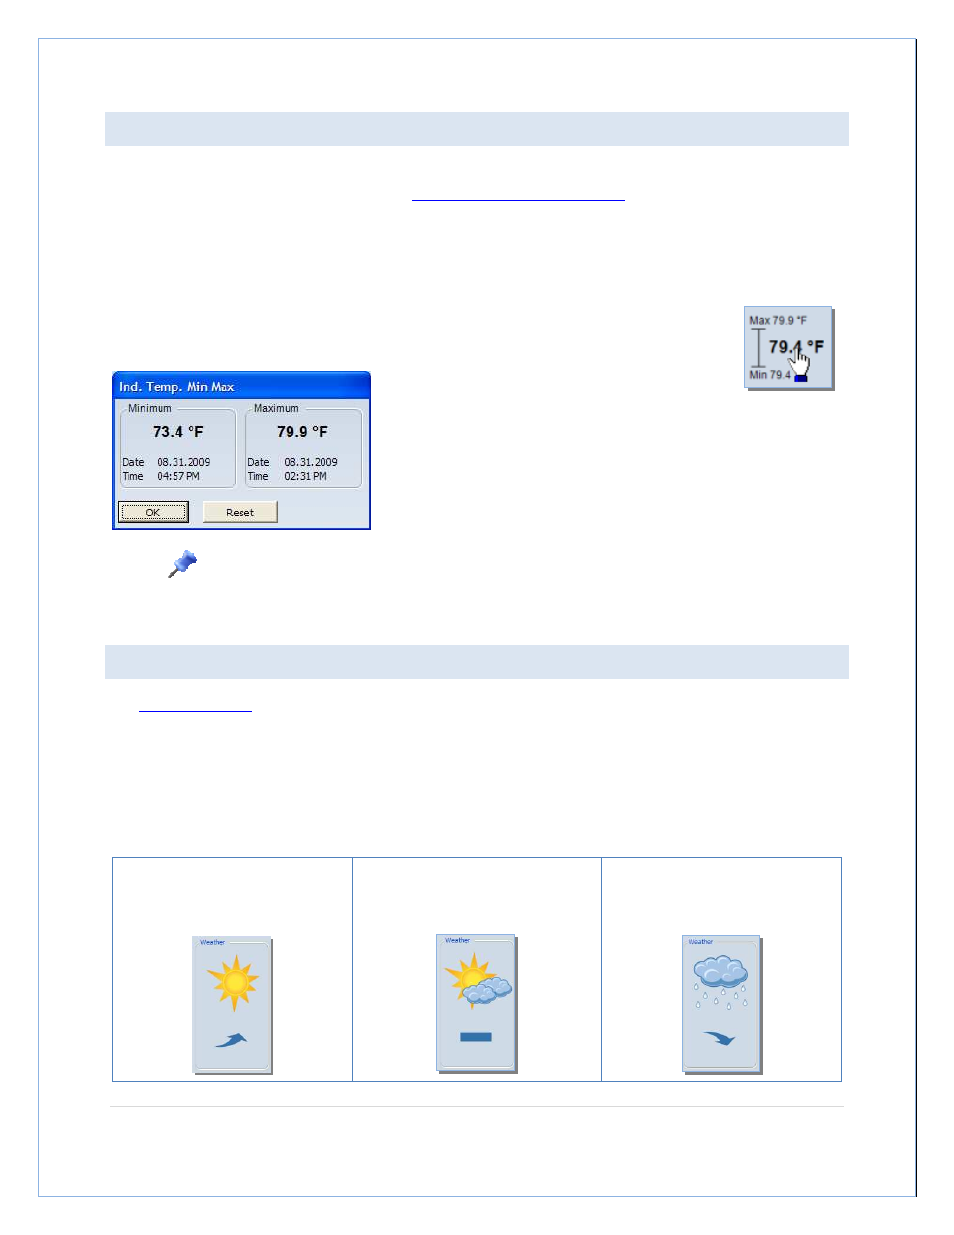
MIN MAX VALUES
The weather station can also store data regarding the minimum and maximum values for several properties. The
actual min and max values are displayed in the
main Heavy Weather Pro window
, in the Current Weather tab.
You can also view the date and time that these values were recorded, by viewing the details of a particular min or
max value. To view the details about the min and max values for a property, first locate the property you wish to
analyze, and then move your mouse cursor over that area.
When you see your mouse cursor to change a hand pointer, double click, and the min max details
window will appear.
From here you can review the details regarding the min and max values
for the property, and also reset the min and max if you wish.
Note: In many cases, when you Reset the Min/Max values, the values go to zero briefly then quickly
refill with the current data as the initial new Mon/Max values.
GRAPHICAL FORECAST
The
graphical forecast
section of Heavy Weather Pro provides a visual representation of what the weather is likely
to be, based on the current and recent values of relative air pressure.
The upper image displays the expected weather condition, and the lower image represents the recent trending of
the relative barometric air pressure.
There are three conditions that Heavy Weather Pro will display:
Fair Weather
Rising Barometer
Partly Cloudy/Sunny
Steady Barometer
Rain / Storm Expected
Falling Barometer