Velleman WS2800 Software User’s Guide User Manual
Page 36
P a g e
| 36
STATUS
The status section of the Properties window tells us if the data type and intervals we have chosen are valid. If we
have selected to display a data type or a time period that is not available in our data records, the status line will
turn red to indicate that the data cannot be displayed. If our selections are valid, the status text will be green.
SAVING A TEMPLATE AS A GRAPH
To display weather data in a chart of graph format, we first need to select the history data and create a template. If
you have not yet done this, please refer to the sections on
Working with History Files
and
Working with Templates
.
You can also choose to use the demo template to get some practice working with graphs.
Once we have selected a
history file
and created a
template
, a data chart or
graph
is generated and displayed in
the
Chart/Data window
. At this point however, the chart is still considered a template and the properties can be
modified as needed.
We may want to save a
permanent copy of this
chart for later use. When
we save a template as a
permanent copy, it is then
referred to as a Graph.
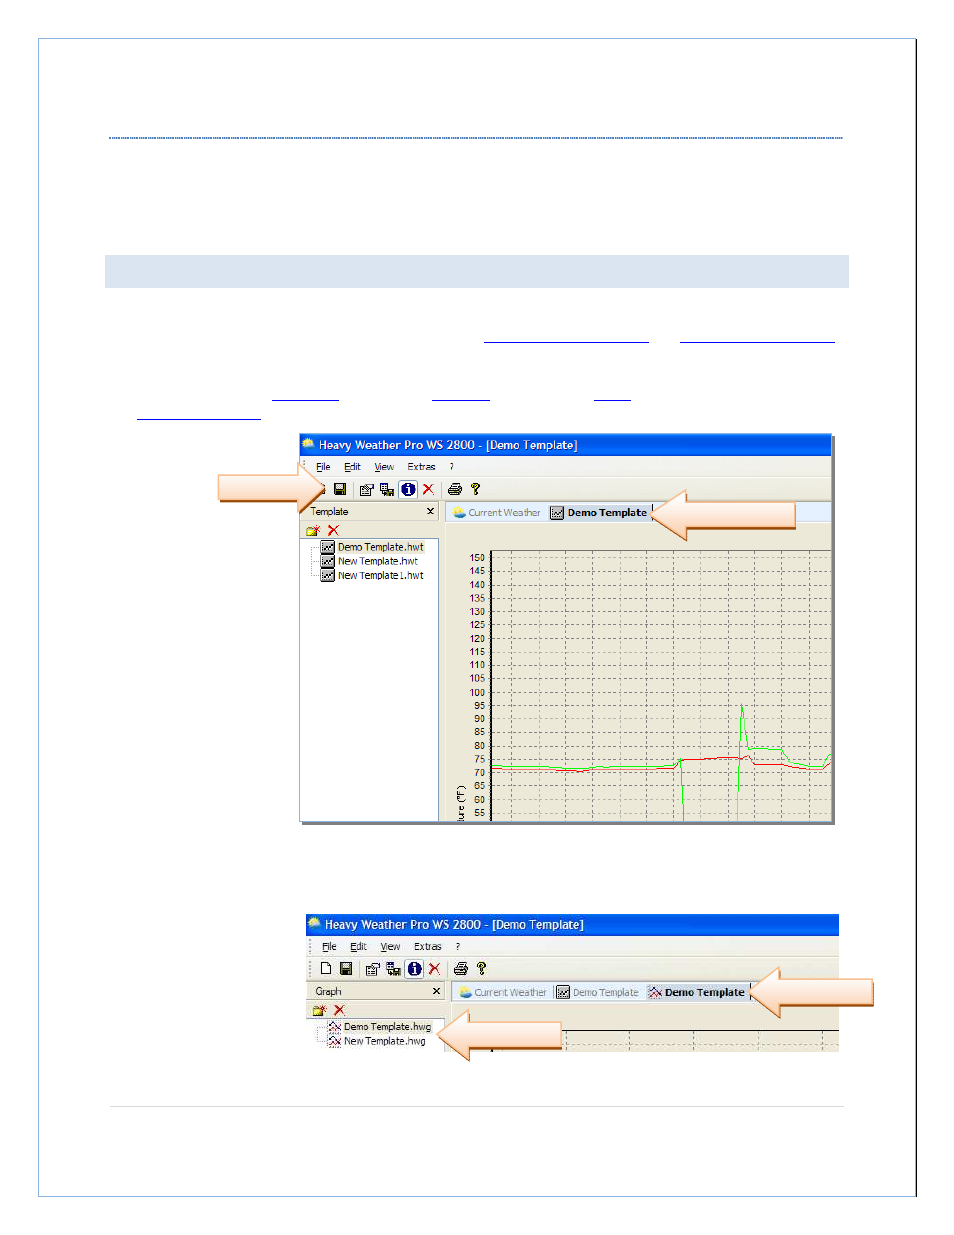
To create a graph, click the
Save button (or the Save as Graph menu selection) while a template displayed in the chart/graph window.
A new tab will appear next to the template tab displaying the graph created from the template. This is the
permanent copy of the
template, now referred to
as a graph.
The File Management
window also switched to
the Graph tab, and displays
the new graph file.
Still a template…
Save button
New Graph Tab
Graph Files