Velleman WS2800 Software User’s Guide User Manual
Page 35
P a g e
| 35
Min and Max:
Use the Min and Max checkboxes if you want to limit the data set to records within a specific range.
Indoor, Outdoor, Dewpoint and Windchill:
For some data types, you can choose to display more or less details. The details available will change depending on
the data type selected.
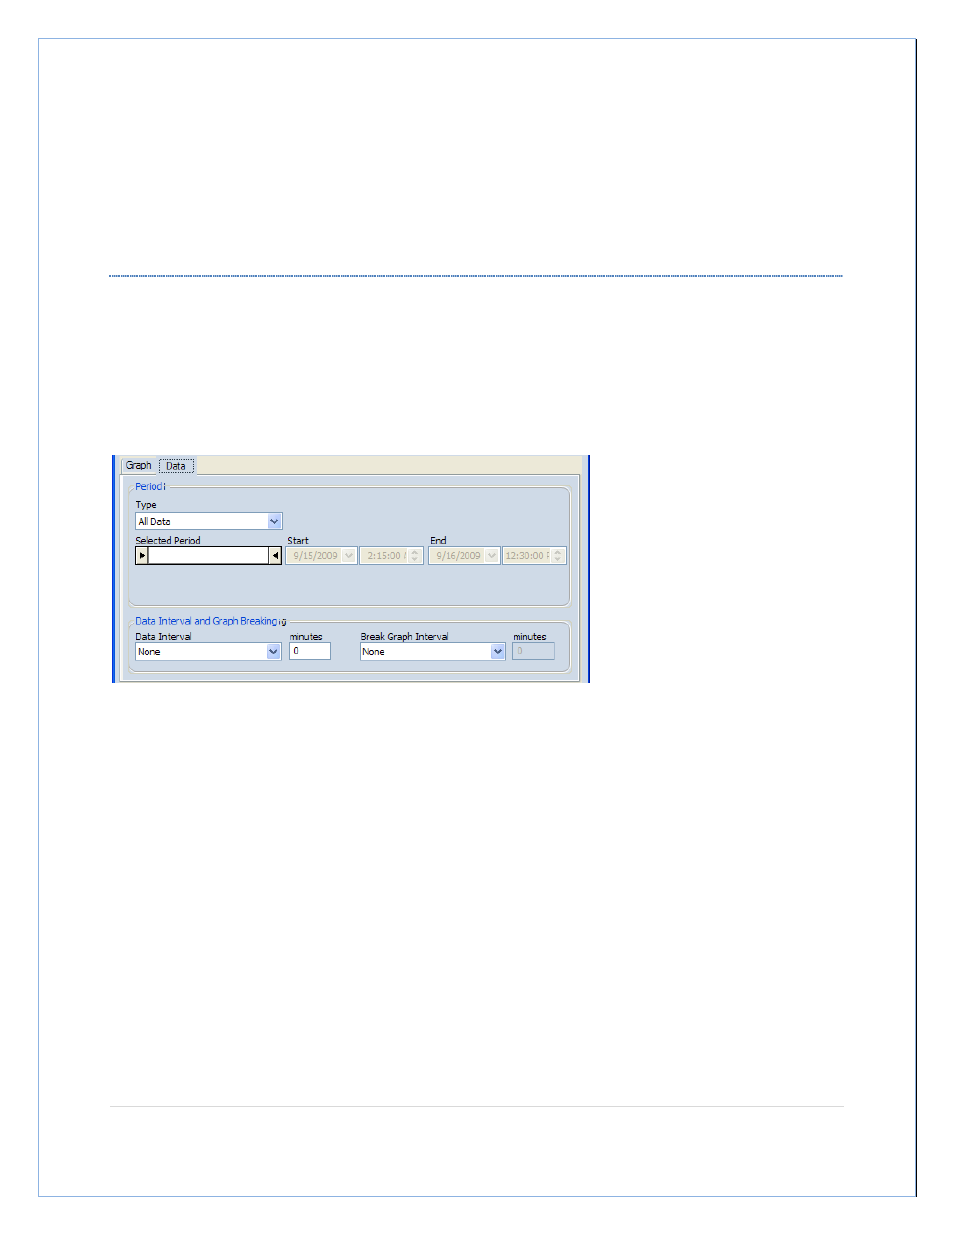
DATA PROPERTIES
These properties allow us to choose the specific data records that will be displayed for the weather data selected
in the graph properties.
Type:
Use this dropdown to select the time period over which the chosen weather data will be displayed. An example
would be if you had selected Indoor Temperature in the Graph properties, here you could choose Current Day for
the time period, and only the Indoor Temperature records from the current day will be displayed on the template.
Selected Period, Start and End:
These fields are provided to give you
a better idea of the time period you
have selected.
The Selected Period shows a
graphical representation of when the
time period occurs. The start and end
date and time display the exact range
of the data record set that will be
used in the template.
If you choose a User Defined period type, these fields can be used to set the properties of the time period.
Data Interval:
The Data Interval setting allows you to define how close together the data points are represented on the chart. A
shorter interval will place more data points in the chart, and will give a more detailed graph line.
Break Graph Interval:
This property places a space, or break, of the selected time amount between the chosen data intervals. This can
help define the data intervals, and make them easier to distinguish from each other.
For example, if we have chosen 1 hour as the data interval there will be a data point every hour on our chart. If the
break graph interval is 30 minutes, there will be a space equal to 30 minute between each 1 hour interval.
Minutes:
The ‘minutes’ field can only be modified if you choose a Data Interval of User Defined. In this case, you can specify
how many minutes apart you wish to place the data points. The chart can only be as precise as the original
recording interval.
When you are using a pre-defined interval (any interval other than User Defined), the minutes field will be read
only and display the chosen interval in minutes.