Chart – Omega Speaker Systems Dual Thermocouple Over the Internet iSE-TC User Manual
Page 26
22
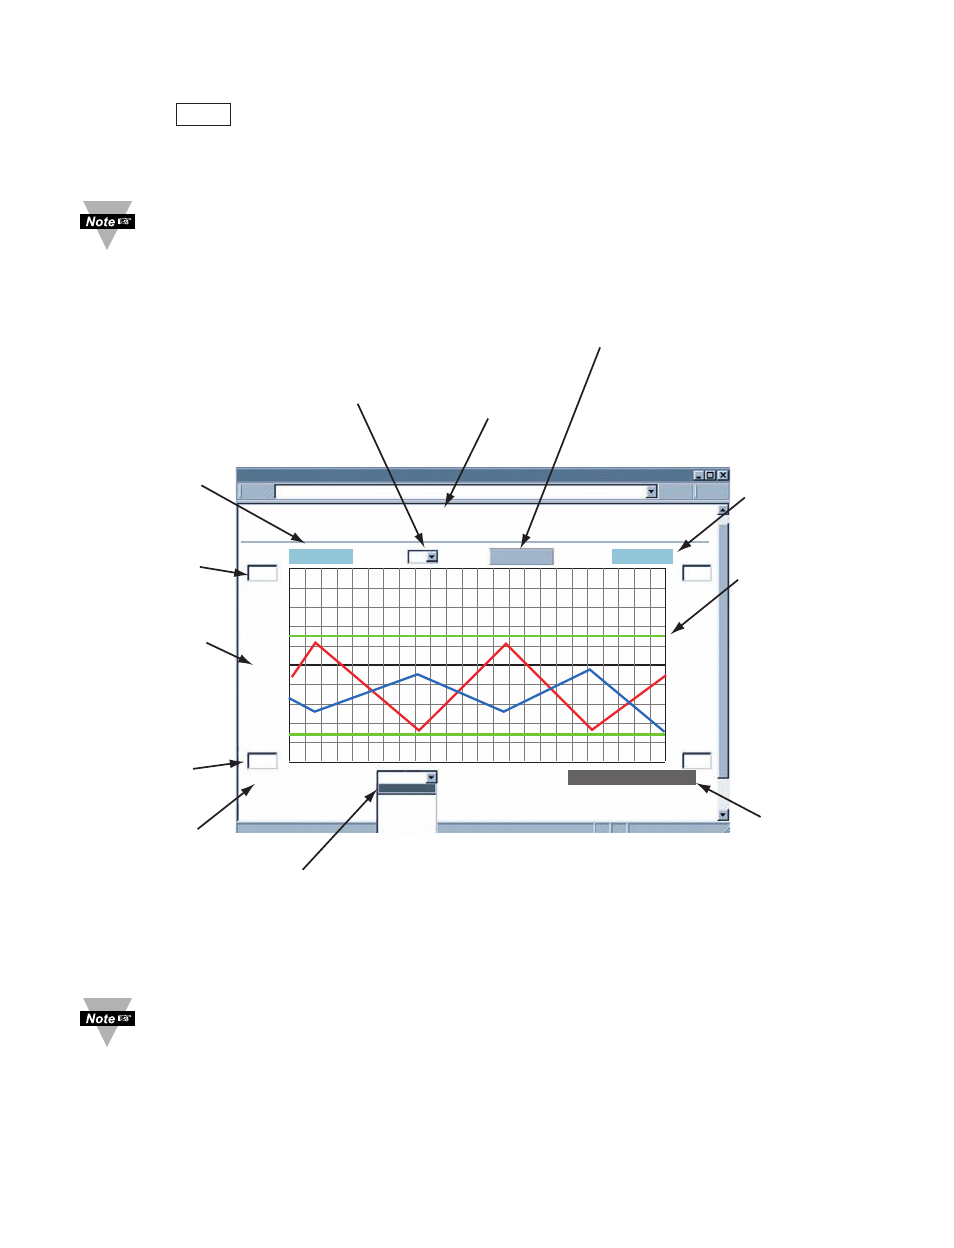
4.3.2 Adjustable Chart
• Click on
, the following page (Figure 4.8) should appear. The Java™ Applet
graph displays Temperature values which can be charted across the full span or within
any narrow range (such as 20 to 30ºC). The time-base can display one minute, one
hour, one day, one week, one month or one year.
If a blank screen appears without any “java application running” or image of a
“Java logo”, please verify you have the latest Java Runtime Environment
installed and configured according to the instructions (refer to Section 4.3.1.1).
If you do not have Java Runtime Environment, you may download it from our
website or contact the Customer Service Department nearest you.
Figure 4.8 Adjustable Chart
To avoid any miscommunications when downloading the stored data from the
“Chart” page, it is strongly recommended to let the recording run for a minimum
of 3 minutes if the time interval is 10 seconds (from “Configuration” page), and
15 minutes if the time interval is 1 minute.
Flash Archive
Main Menu
http://192.168.1.200
Flash Archive
(1 Hour/Div)
1 Day
1 Day
1 Week
1 Month
1 Year
1 Minute
1 Hour
03/01/2008 09:42:10
32
9.0/Div
122
Input 1:
32
122
Input 2:
Input 2:
Archives_Done
F
03/02/2008 09:42:10
SP1_L(below)=044.5 F SP1_H (above)=090.0 F
67.8
77.7
9.0/Div
User selectable time base
1 minute, 1 hour, 1 day,
1 week, 1 month, or 1 year
User selectable
temperature range
User selectable
temperature range
Number of degrees
per division
based on
temperature range
Actual Input 1
Temperature
User selectable
temperature units: F or C
Actual Input 2
Temperature
Title
Archives_Inactive:
1minute or 1hour
Archives_Enable:
1Day, 1Week, 1Month, or 1Year
Archives_Done:
charting starts for the “time” selected in the
lower pull down menu
Start Time
End Time
Setpoint boundary
Chart