National Instruments Order Analysis Toolset User Manual
Page 34
Chapter 3
Gabor Transform-Based Order Tracking
LabVIEW Order Analysis Toolset User Manual
3-4
ni.com
processed by a Gabor transform, the index of the n
th
order is given by the
following equation.
,
where RPM is the averaged instantaneous rotational speed in the time
interval, N is the number of frequency bins, and f
s
is the sampling
frequency. In the LabVIEW Order Analysis Toolset, the number of
frequency bins N equals the length of the window.
Each order component in the order domain, as well as each harmonic in
the frequency domain, has a side band. Thus, in the joint time-frequency
domain, each order component contains the coefficients along the order
curve and some coefficients in the neighborhood. You must include the
coefficients in the neighborhood when selecting the order component.
Constant frequency bandwidth and constant order bandwidth are two ways
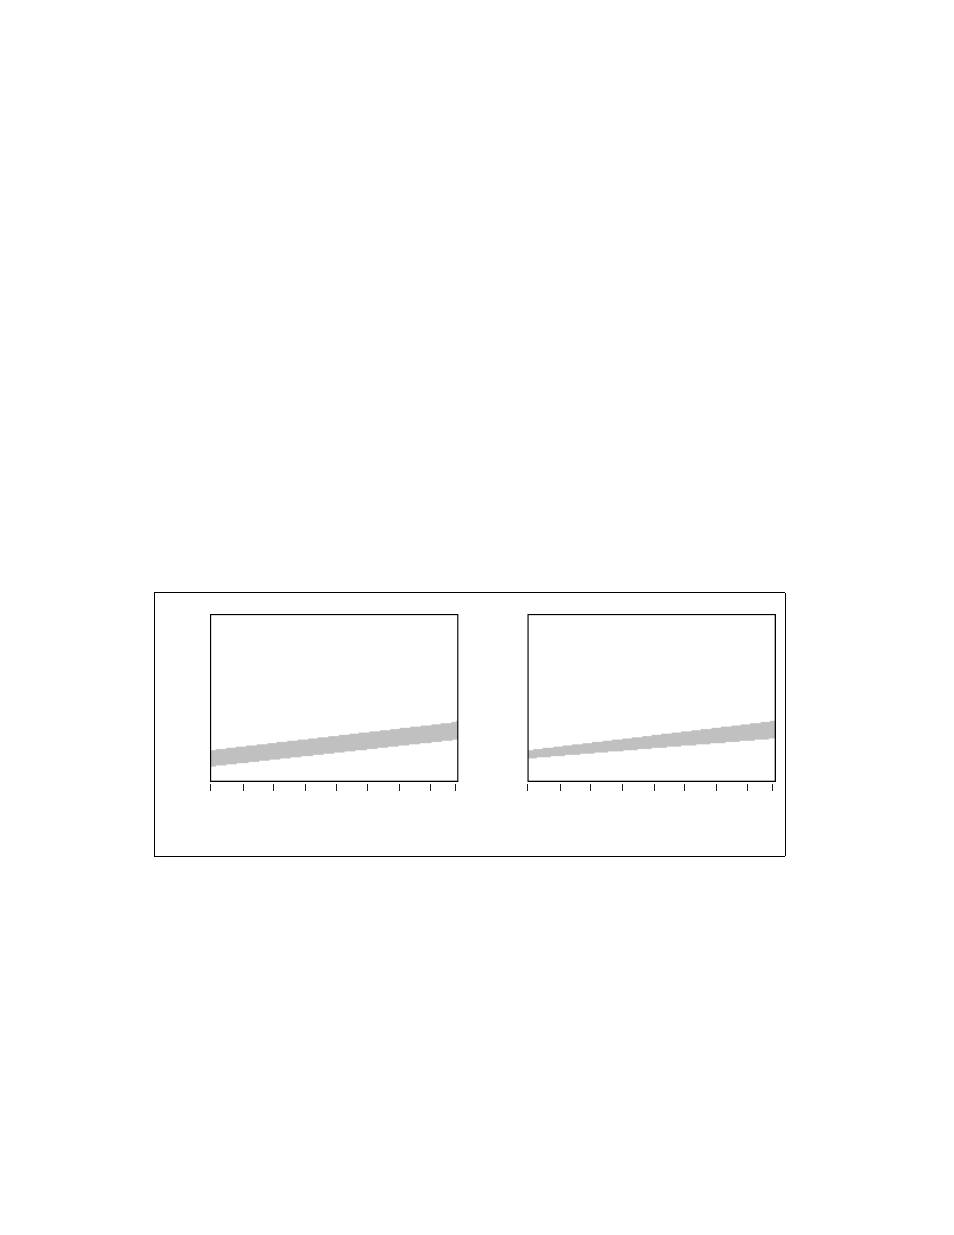
to define the bandwidth of the neighborhood for an order curve. Figure 3-3
illustrates constant frequency bandwidth and constant order bandwidth.
Figure 3-3. Constant Frequency Bandwidth and Constant Order Bandwidth
Figure 3-3(a) illustrates constant frequency bandwidth. The neighborhood
is considered as the region between
and
, where
∆ f is a constant frequency. The frequency of the bandwidth ∆ f remains
constant over time.
index
round
RPM
60
-------------
N
f
s
----
n
Ч
Ч
=
500–
400–
300–
200–
100–
0–
0
5
25
30
35
10
15
20
39
Time (s)
(a) Constant Frequency Bandwidth
0
5
25
30
35
10
15
20
39
Time (s)
(b) Constant Order Bandwidth
F
requency (Hz)
500–
400–
300–
200–
100–
0–
F
requency (Hz)
n
RPM
60
-------------
∆ f
2
-----
+
n
RPM
60
-------------
∆ f
2
-----
–