Variable rotational speed, Figure 2-4. constant frequency, Variable rotational speed -6 – National Instruments Order Analysis Toolset User Manual
Page 21
Chapter 2
Order Analysis
LabVIEW Order Analysis Toolset User Manual
2-6
ni.com
Variable Rotational Speed
In addition to testing rotating machinery running at a constant speed,
researchers often perform tests involving run-up and run-down. Like a
swept-sine stimulus, testing run-up and run-down provides a stimulus over
a wide range of frequencies.
According to Fourier analysis theory, the frequency
bandwidth of a signal
is proportional to the change in the frequency and amplitude of the signal.
The faster the frequency changes, the wider the overall frequency
bandwidth becomes, as measured from the power spectrum.
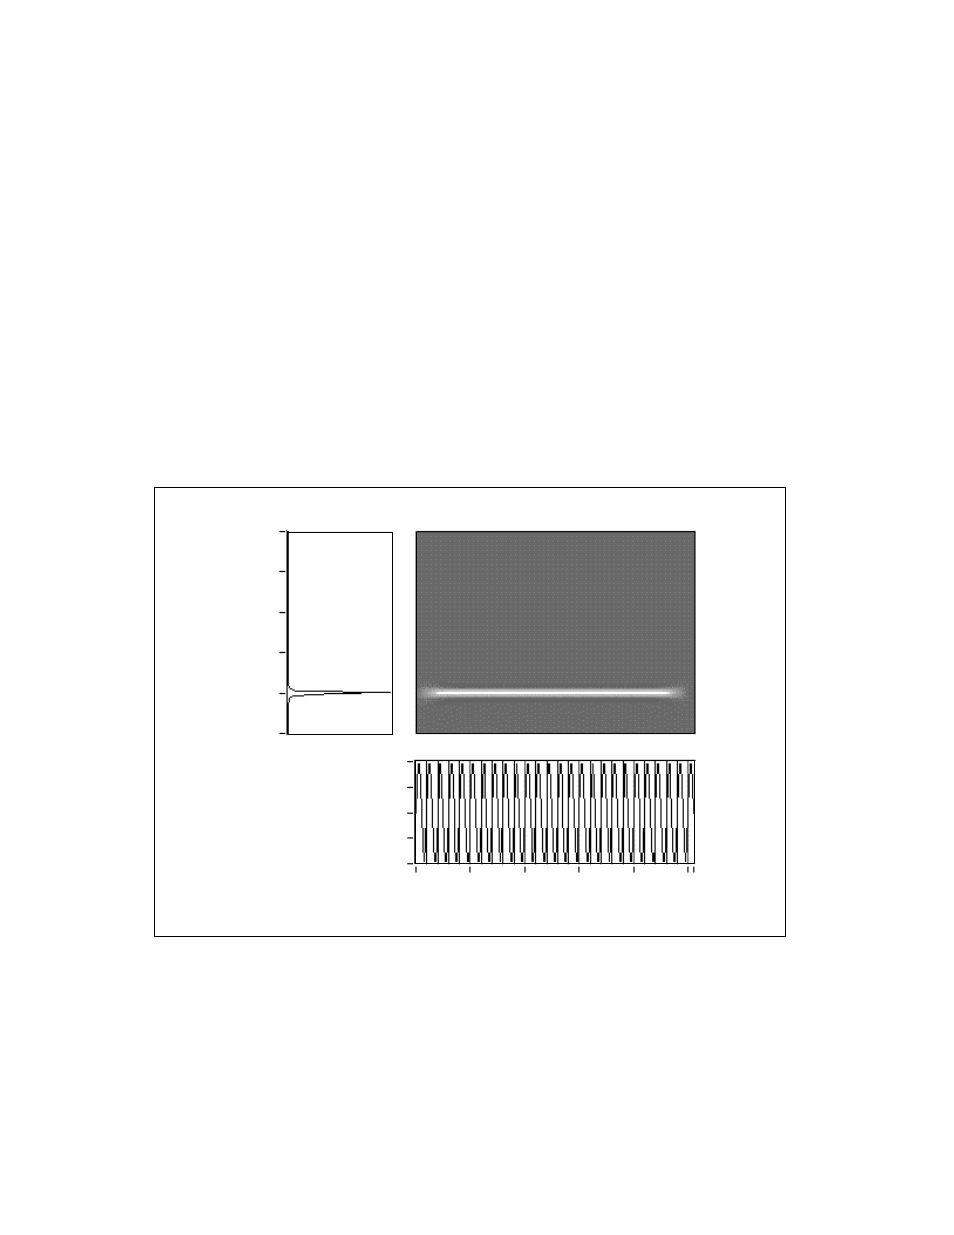
Figure 2-4 illustrates a conventional power spectrum on the left and the
frequency-time spectral map on the right for a signal with constant
frequency and amplitude.
Figure 2-4. Constant Frequency
In Figure 2-4, the overall frequency bandwidth is proportional to the
change in frequencies. When the frequency and amplitude are constant over
Spectrum
Frequency-Time Spectral Map
0.5
0.4
0.3
0.2
0.1
0.0
Time Waveform
1.0
0.5
0.0
–0.5
–1.0
0
50
100
150
200
255
F
requency
Time