Figure 2-3. pc fan running at constant speed, E 2-3 il – National Instruments Order Analysis Toolset User Manual
Page 20
Chapter 2
Order Analysis
© National Instruments Corporation
2-5
LabVIEW Order Analysis Toolset User Manual
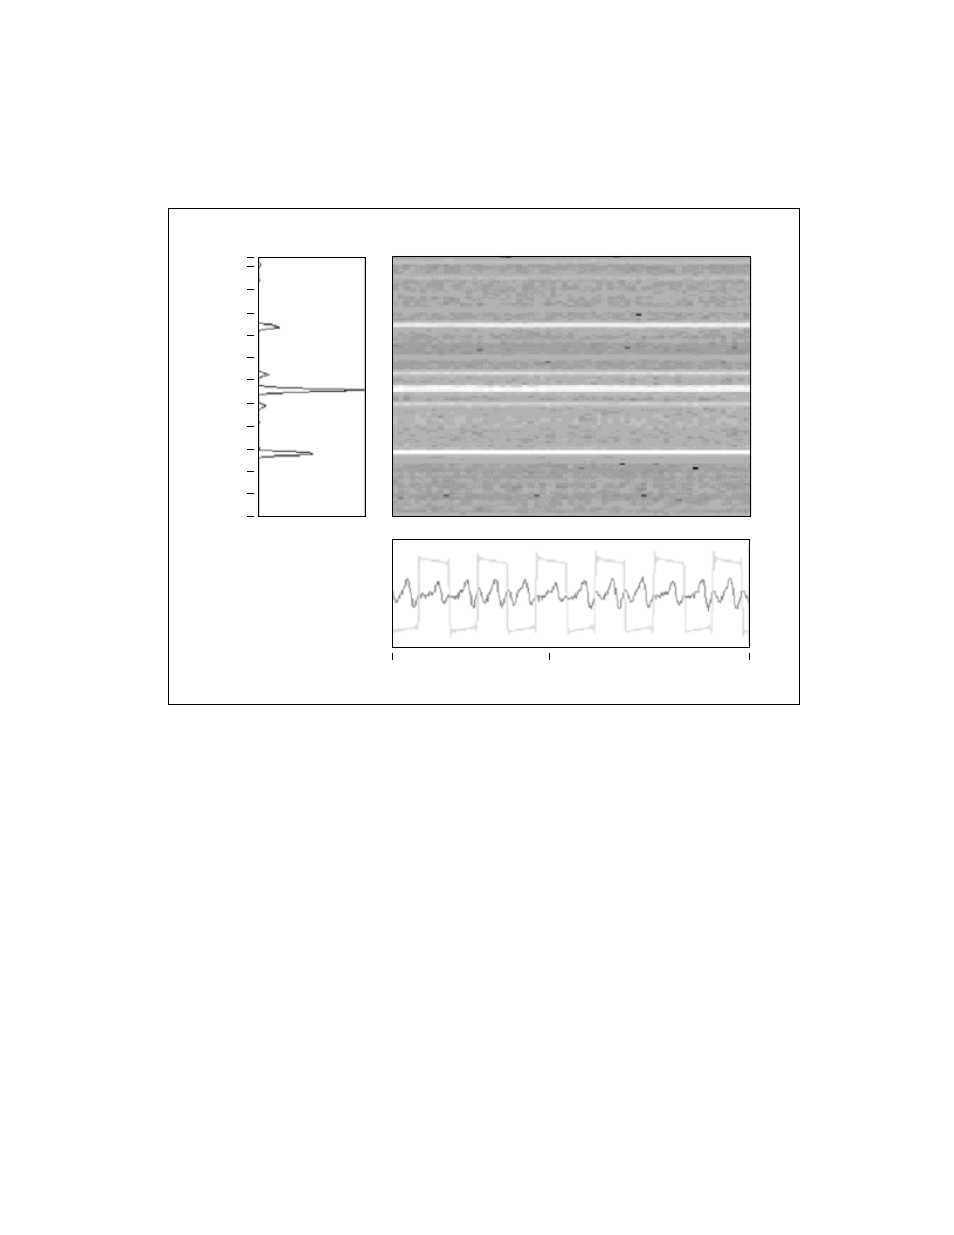
Figure 2-3. PC Fan Running at Constant Speed
The bottom plot in Figure 2-3 depicts the tachometer pulses and the signal
from an accelerometer mounted on the PC fan. The plot on the left in
Figure 2-3 illustrates a conventional power spectrum based on the fast
Fourier transform (FFT). The upper-right plot in Figure 2-3 shows the
frequency-time spectral map computed from the short-time Fourier
transform (STFT) with a 1,024-point Hanning window. Because of the
constant rotational speed of the fan during data acquisition, you can
identify several peaks in both the power spectrum and the frequency-time
spectral map. The peaks indicate different orders and appear in the
frequency-time spectral map as white lines.
STFT
Spectrum
570
500
450
400
350
300
250
200
150
100
50
0
F
requency (Hz)
31.9
31.9
31.9
- Instrument Driver NI-DMM (12 pages)
- 24-Bit Half/Full-Bridge Analog Input Module NI 9237 (36 pages)
- NI PXIe-8105 (76 pages)
- PXI NI 5401 (60 pages)
- Fieldpoint CFP-2210 (38 pages)
- NI 781xR (48 pages)
- NI 6233 (180 pages)
- 6508 PCI-DIO-96 (93 pages)
- PXI/CompactPCI Embedded Computer NI PXI-8108 (83 pages)
- NI 9233 (34 pages)
- NI USB-9219 (25 pages)
- GPIB-PC (262 pages)
- cFP-RTD-122 (15 pages)
- USB device 625x (23 pages)
- Isolated Analog Input Modules SCC-AI01 (18 pages)
- NI PCI-6111 (118 pages)
- NI USB-6008 (32 pages)
- PC-DIO-24 (75 pages)
- NI 9474 (31 pages)
- NI 6013 (109 pages)
- PXI-1428 (46 pages)
- NI PCI-5911 (51 pages)
- 2 SD Card Memory Module NI 9802 (16 pages)
- cFP-20xx (24 pages)
- NI USB-9234 (23 pages)
- NI 9871 (24 pages)
- Interface Device NI PCI-1426 (35 pages)
- AT E Series (184 pages)
- 9211A (19 pages)
- Module NI PXI-8250 (39 pages)
- 8330 Series (30 pages)
- NI PXIe-8360 (40 pages)
- Deterministic Ethernet Expansion Chassis NI 9144 (65 pages)
- NI 6509 (23 pages)
- NI MATRIXx Xmath (127 pages)
- NI 9481 (23 pages)
- Monochrome Image Acquisition Device NI 1410 (34 pages)
- VXI-1394 (74 pages)
- NI PXI-8104 (69 pages)
- NI 9235 (38 pages)
- 370620B-01 (17 pages)
- FP-RTD-124 (15 pages)
- VXI-USB (61 pages)
- NI PCI-8254R (45 pages)
- Interface Device NI PCI-8254R (16 pages)