Figure 2-5. frequency changes over time – National Instruments Order Analysis Toolset User Manual
Page 22
Chapter 2
Order Analysis
© National Instruments Corporation
2-7
LabVIEW Order Analysis Toolset User Manual
time, the overall frequency bandwidth, as measured from the conventional
power spectrum, is the minimum.
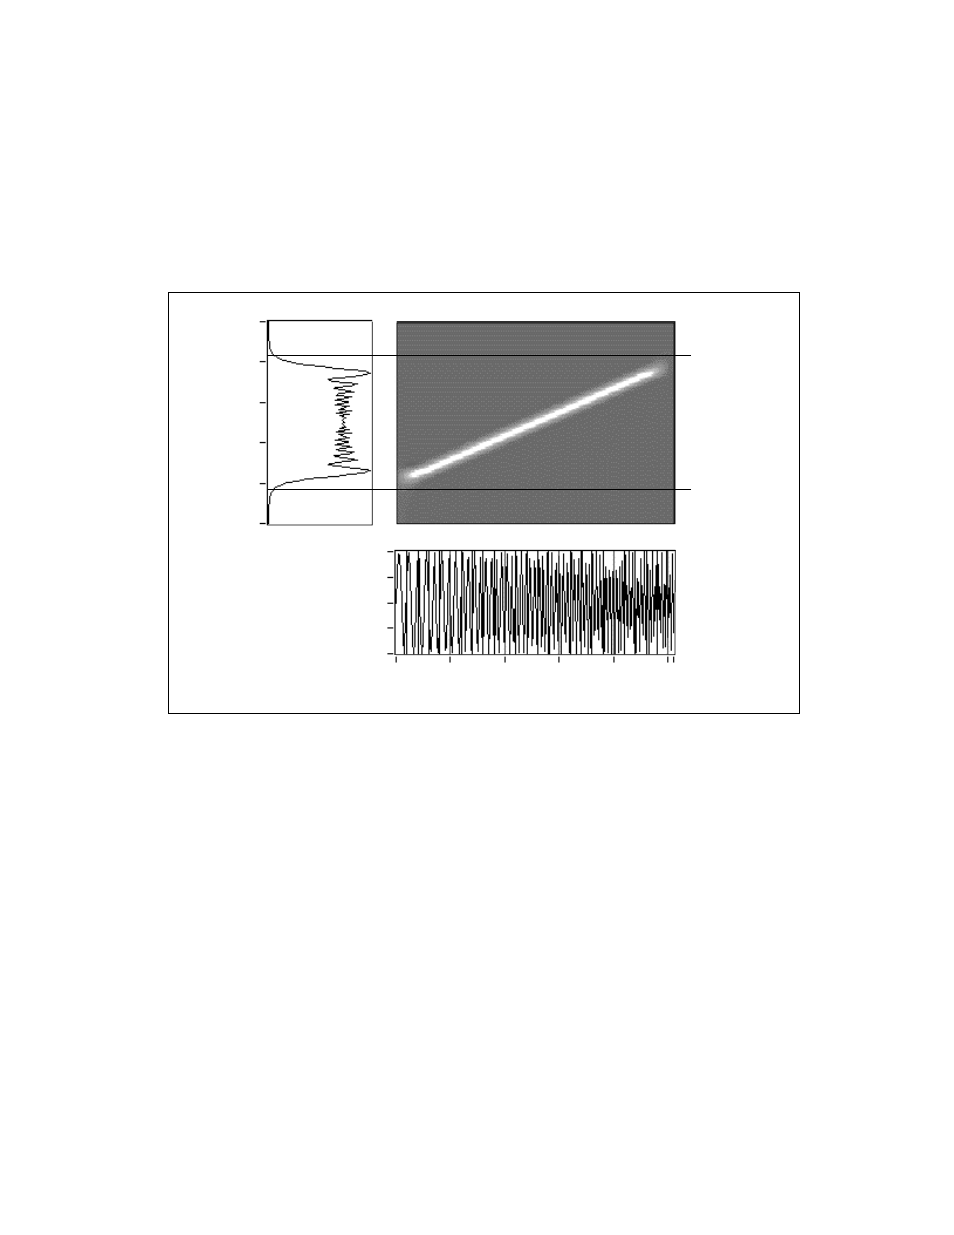
Figure 2-5 depicts a signal whose frequency changes as a function of time.
Figure 2-5. Frequency Changes Over Time
Although the signals in Figures 2-4 and 2-5 have similar frequency
bandwidths at each time instant, the overall frequency bandwidths shown
in their corresponding power spectra are rather different. As you can see
from the two FFT-based power spectra in Figures 2-4 and 2-5, the overall
frequency bandwidth of the signal whose frequency increases with time in
Figure 2-5 is much wider than that of the signal whose frequency is
constant in Figure 2-4. When frequency or amplitude vary with time,
the corresponding overall frequency bandwidth, as measured from the
conventional power spectrum, becomes wide.
When the frequency bandwidth of the fundamental component widens, the
bandwidths of the associated harmonics also widen. The widening of the
bandwidths of the harmonics eventually causes the frequency bandwidth of
the harmonics to overlap in the conventional power spectrum. When the
Spectrum
Frequency-Time Spectral Map
0.5
0.4
0.3
0.2
0.1
0.0
Time Waveform
1.0
0.5
0.0
–0.5
–1.0
0
50
100
150
200
255
F
requency
Time
Overall
Bandwidth
Becomes
Wide as the
Frequency
Changes