1 diagnostic plotter, Diagnostic plotter, Figure 71 - diagnostic plotter – Motorola MotoWI4 PTP 600 Series User Manual
Page 139
137
For example, when histogram 1 fills up and starts to overflow the first minute of overflow is
analyzed and the maximum, minimum and mean over that minute are computed and inserted
into histogram 2. When histogram 2 fills up and starts to overflow the first hour of overflow is
analyzed and the maximum, minimum and mean over that hour is computed and inserted into
histogram 3. When histogram 3 start to overflow the overflow data is simply discarded.
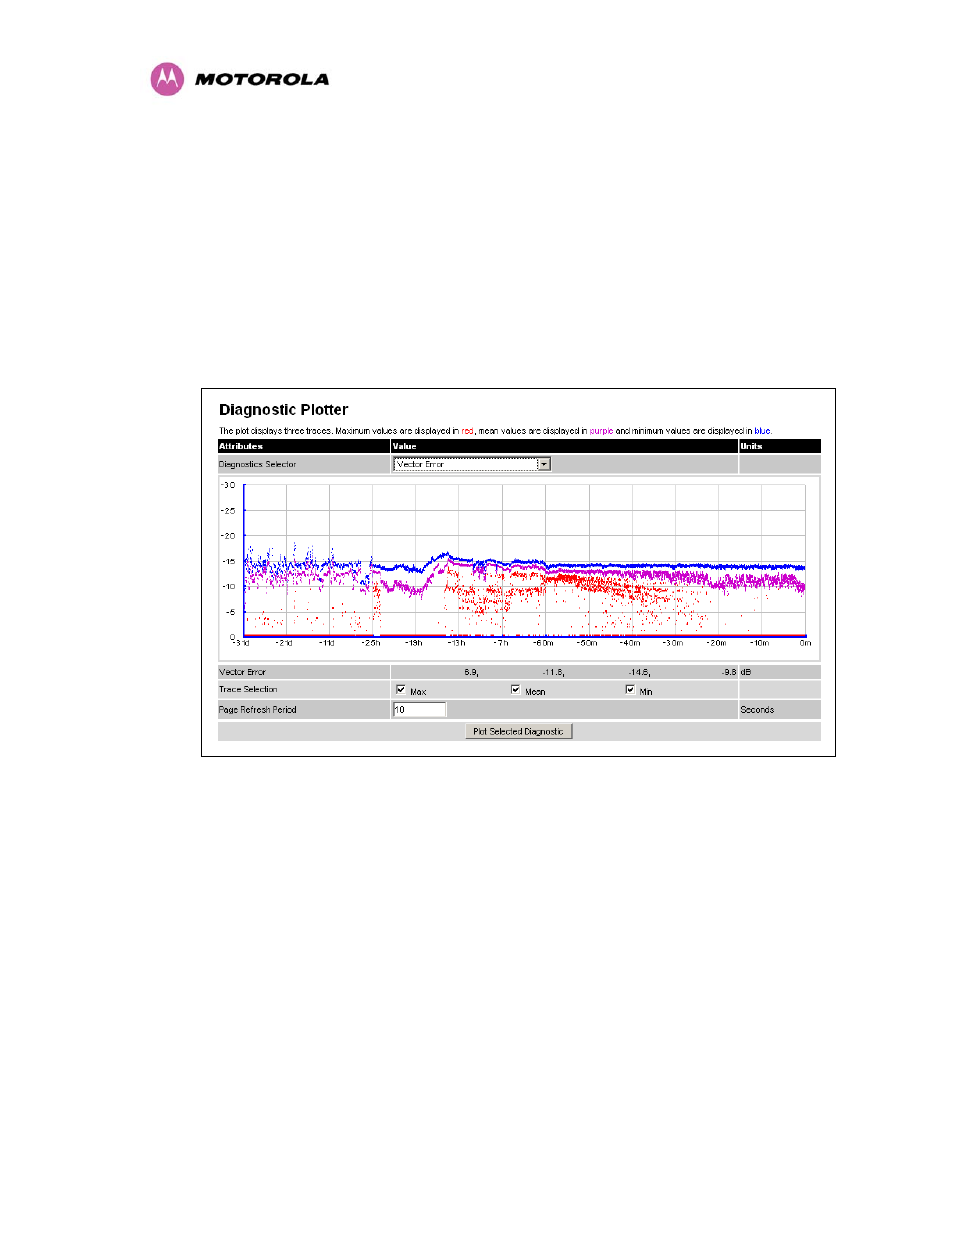
8.3.11.1 Diagnostic Plotter
New for the PTP 600 Series is the system administration diagnostic plotter facility see Figure
Figure 71 - Diagnostic Plotter
The diagnostic plotter allows the system administrator to view the cascading histogram data
in an easily accessible graphical form. The plot always displays three traces, maximum,
minimum and mean by default. The diagnostic selector allows the user to select the various
categories of histogram.
- SB5101U DOCSIS 2.0 Cable Modem (16 pages)
- PTP 500 (20 pages)
- Netopia 3347-02-ENT (3 pages)
- SBV5220 (64 pages)
- AP-51XX (698 pages)
- SURFboard SVG2501 Series (34 pages)
- MESH Wireless Router MWR6300 (2 pages)
- MVME712AM (74 pages)
- SURFBOARD SBG1000 (16 pages)
- RSGu3502 (5 pages)
- SURFboard SBG941U (78 pages)
- Netopia 2240N-VGx (5 pages)
- SURFboard SVG2501 (8 pages)
- WR850G (93 pages)
- WR850GP (95 pages)
- USBW 200 (12 pages)
- ONCE SC140 (28 pages)
- Netopia 3300 (368 pages)
- MPC8260 (1006 pages)
- WNS25 (2 pages)
- Netopia 7000 (254 pages)
- Viadux 2000 Subscriber Bridge RC2010 (1 page)
- MVME5100 Series (5 pages)
- ColdFire MCF5282 (766 pages)
- MC9S12C-Family (136 pages)
- CG4500 (36 pages)
- SBG900 (130 pages)
- SURFBOARD SB5100 (2 pages)
- SURFboard SB6180 (20 pages)
- SURFBOARD SBG900 (16 pages)
- SURFboard SVG1501U (83 pages)
- SB5100 (74 pages)
- T3 (2 pages)
- H375 (5 pages)
- NETOPIA 2247/57-62 (22 pages)
- SBV5120 (56 pages)
- SBV5120 (57 pages)
- RG2200 (88 pages)
- CME-12B/BC (18 pages)
- SURFboard 574823-001-a (2 pages)
- SURFboard Cable Modem (66 pages)
- CME-12D60 (19 pages)
- DIGITAL VOICE MODEM SBV5122 (24 pages)
- SB4000 (2 pages)
- Canopy FSK and OFDM radios PTP 200 (OFDM (56 pages)