Fluke NetDAQ 2645A User Manual
Page 260
2640A/2645A NetDAQ
Users Manual
G-6
7.
Continue with other Excel functions to show charts and features. (See your
Excel documentation.)
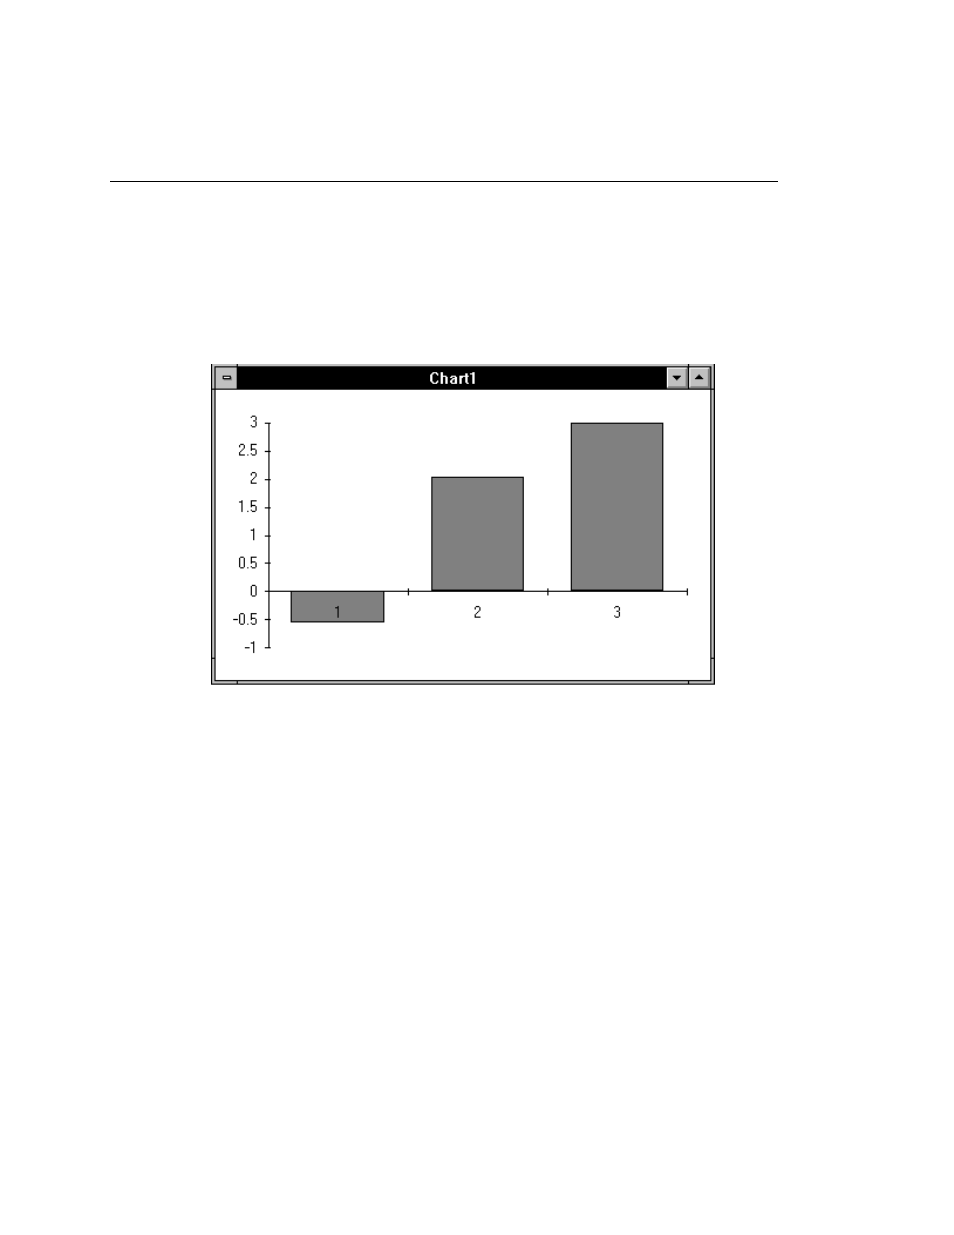
For example, select cells A1, A2, and A3 (click on each cell while holding
down the
Click on Chart and then OK. A chart is displayed for the three channels,
which updates with each new measurement at a maximum rate of once per
second (see the example below).
This manual is related to the following products: