Intel AS/400 RISC Server User Manual
Page 223
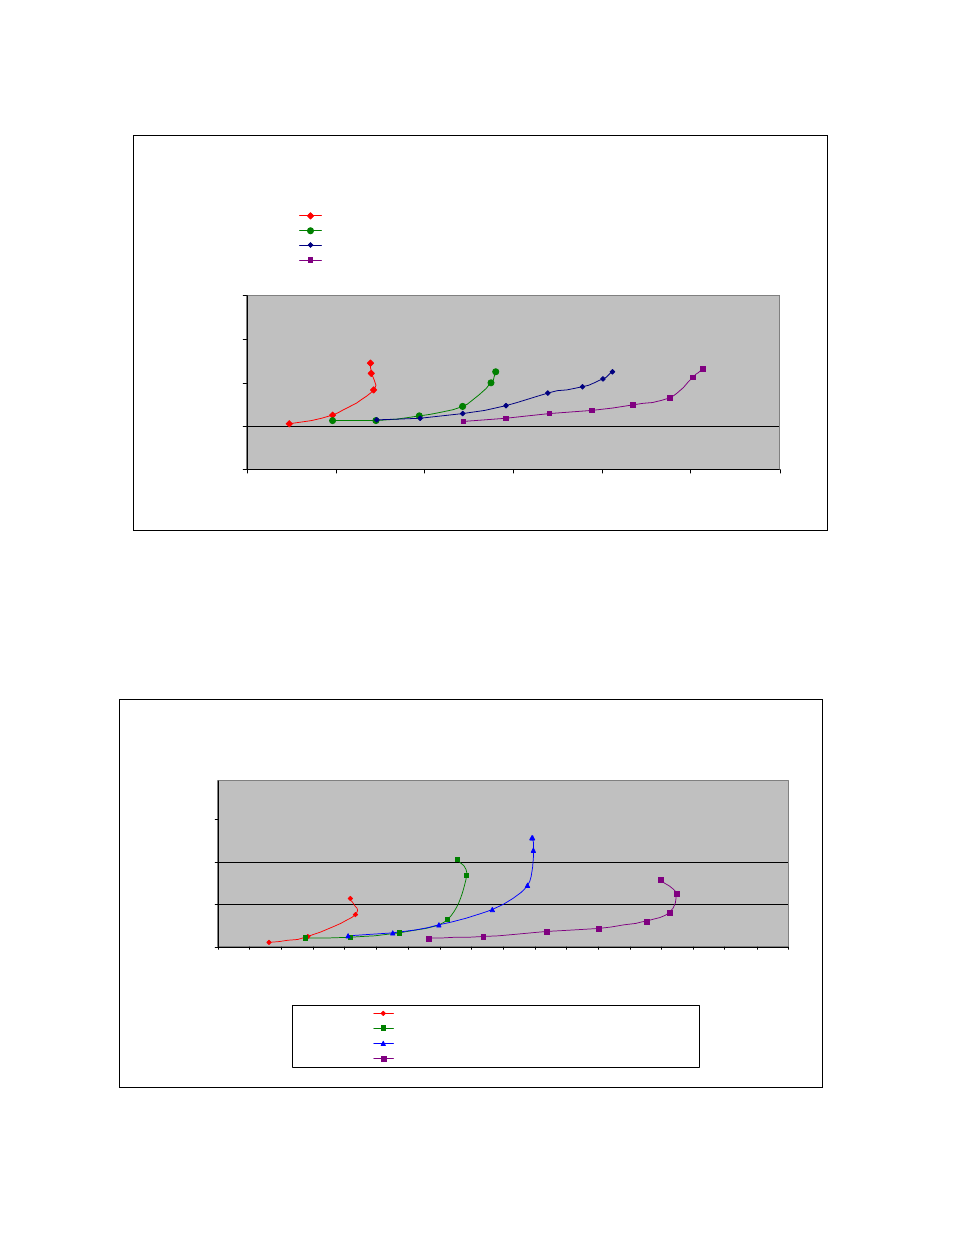
The chart above shows some basic performance scaling for 1, 2, 3 and 4 processors. For this
comparison both partition measurements were done with the processors set up as shared, and
with the IBM i operating system partition set to capped. The rest of the resources stay constant,
which consists of 90 RAID1 DDMs in a DS4800 under 16 LUNs 2 GB of memory assigned to
VIOS and 28 GB assigned to the IBM i operating system partition. Note that only 1 LPAR is
running at the time of the experiment.
IBM i 6.1 Performance Capabilities Reference - January/April/October 2008
©
Copyright IBM Corp. 2008
Chapter 14 DASD Performance
223
VIOS/IBM i operating system JS22 Express
DS4800 (90 DDMs)
Commercial Performance Workload
0.001
0.01
0.1
1
10
0
10000
20000
30000
40000
50000
60000
Transactions/Minute
R
esponse Ti
m
e
(s
ec)
IBM i operating system .8 Processor VIOS .2 Processor
IBM i operating system 1.7 Processor VIOS .3 Processor
IBM i operating system 2.6 Processors VIOS .4 Processors
IBM i operating system 3.5 Processors VIOS .5 Processors
VIOS/IBM i operating system JS22 Blade
DS4800 (90 DDMs)
Commercial Performance Workload
0.001
0.011
0.021
0.031
0
500
1000
1500
2000
2500
3000
3500
4000
4500
5000
5500
6000
6500
7000
7500
8000
8500
9000
ASP Throughput OP/S
Av
e
ra
g
e
DAS
D Re
s
p
o
n
s
e
T
im
e
(S
e
c
on
ds
)
i5OS .8 Processor VIOS .2 Processor
i5OS 1.7 Processor VIOS .3 Processor
i5OS 2.6 Processors VIOS .4 Processors
i5OS 3.5 Processors VIOS .5 Processors