Super Systems XGA Viewer User Manual
Page 24
XGA Viewer Operations Manual
Super Systems Inc.
Page 24 of 46
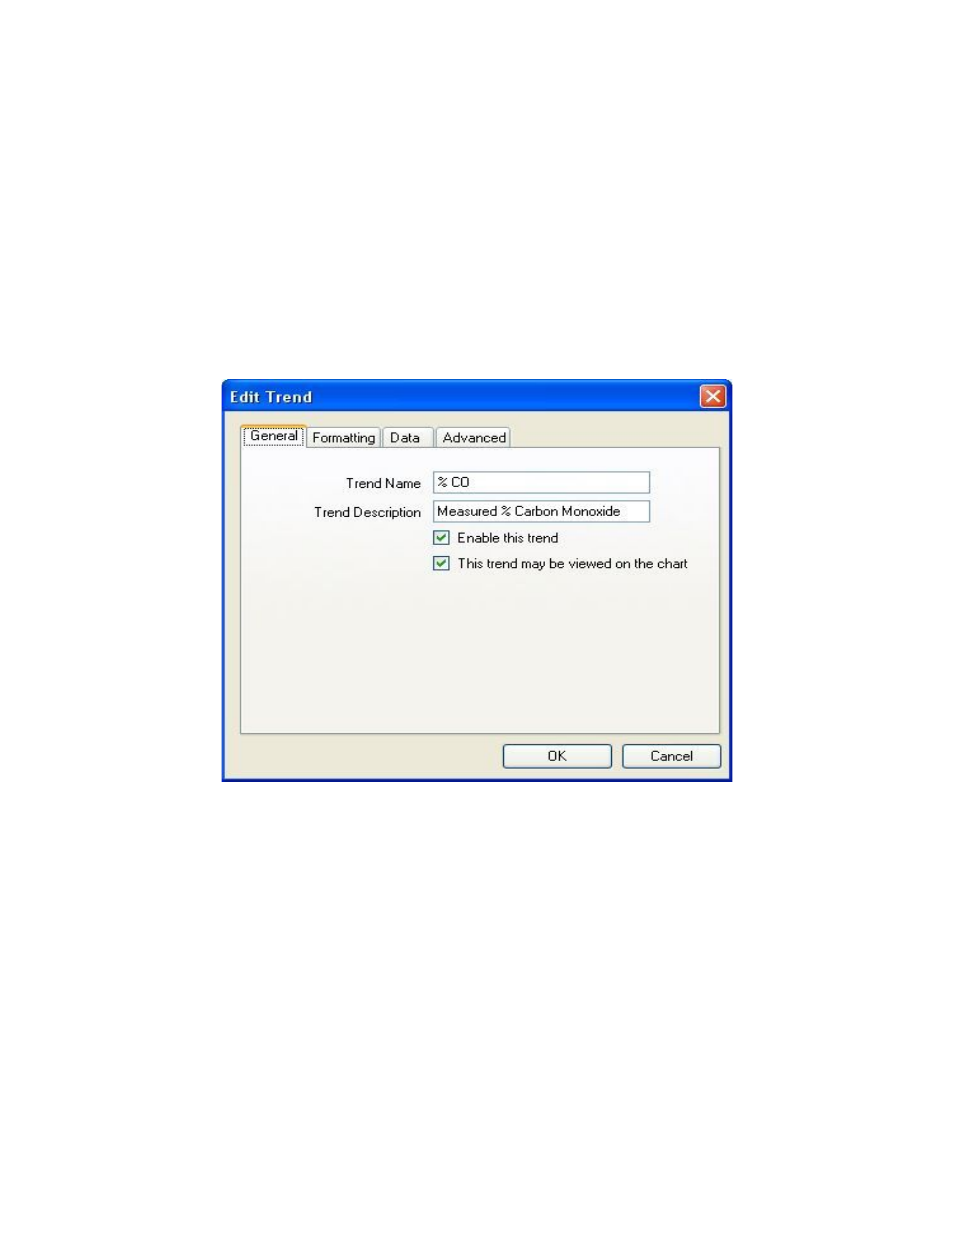
General Tab:
The “Trend Name” will be the name for the trend. This is how the trend will be identified on the
chart, tabular data, and any printed material. The name should be both short and descriptive.
The “Trend Description” will be a brief description of what the trend is. This will be displayed on
the
Edit Template
screen. The description, like the name, should be both short and descriptive
of the trend.
The “Enable this trend” checkbox will enable the trend, which means that the SSi XGA Viewer
software will begin to display the data logging for that value.
Note: All of the variables are
logged all of the time, but the user can decide which to display and which to not
.
The “This trend may be viewed on the chart” checkbox will allow the trend to be viewed on the
chart display.
Figure 27 - "Edit Trend" window – General tab
Formatting Tab:
The “Units” will be the display units for the trend. This could be a % for a gas trend, such as
%C, or it could be °F or °C for a temperature trend.
The “Decimal Places” will be the number of decimal places to display on the trend. This value
can range anywhere from 0 to 4 decimal places displayed.
The “area” section will set up how the trend is displayed on the chart. The “Color” will be the
color of the trend line and trend information displayed on the left of the screen. The “Chart
Min” will be the minimum value for the range of the chart. The “Chart Max” will be the
maximum value for the range of the chart.