Understanding the bar graphs and indicators – Omnia Audio Omnia A/XE User Manual
Page 50
are editing a preset file through the Preset Manager.
3. Below the block diagram and the meter section you will find the parameter controls and
the bypass switch. Use the sliders, knobs and switches to change the parameter values.
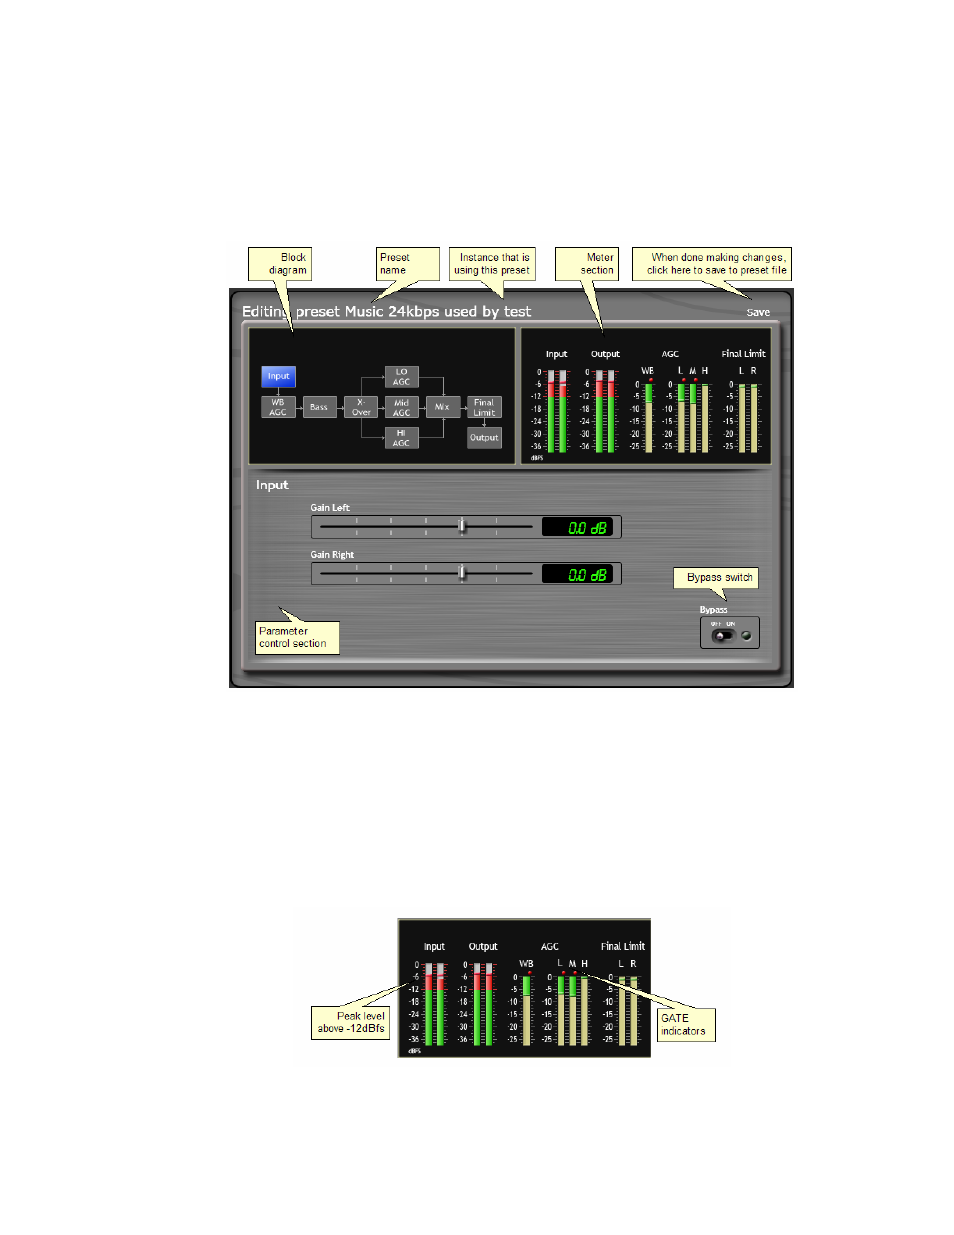
Understanding The Bar graphs and Indicators
The bar graphs are capable of indicating more than just level information. The texture and
density of the audio signal can be observed, based upon the dynamic action of the bar
graphs, and peak-responding “pills”. Of interest are the “pills” at the end of the input and
output meters, as they indicate peak level. The bar section represents the RMS average of
the signal. Wide dynamic range will display a separation between the pills and the bar,
whereas signal with little peak information will cause the pills to ride on the crest of the bar
graph. The bar graphs can indicate up to 25 dB of gain reduction.
The bar graphs provide a wealth of information about the processing control in Omnia
A/XE. The algorithms automatically adapt the style of compression/limiting control being
employed on a moment-by-moment basis. This can be deduced if the metering is studied
44 | Processing Audio