Genee World ClassComm User Manual
Page 77
77
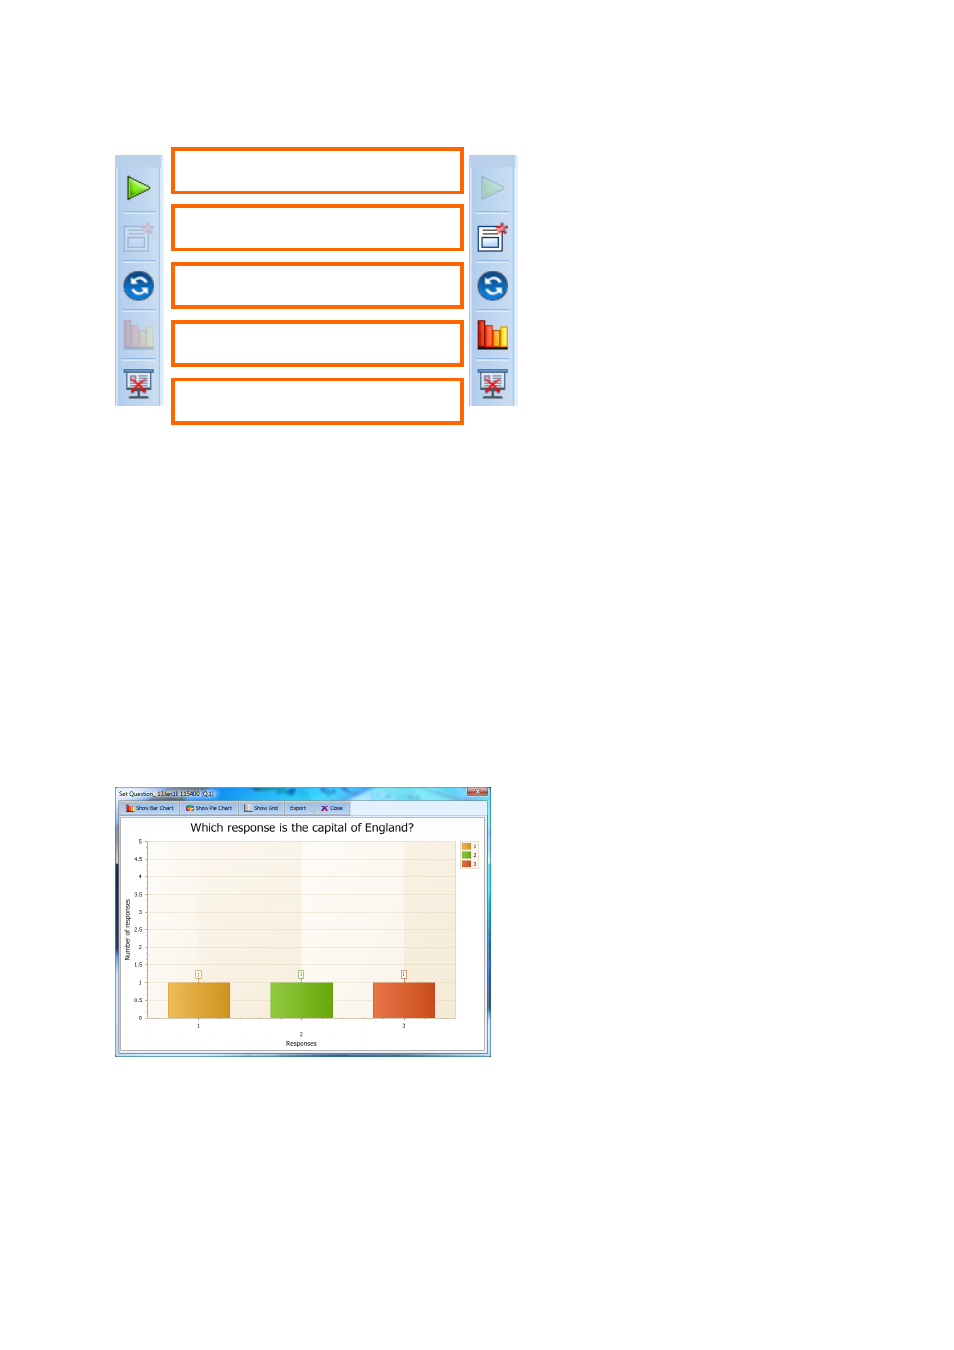
After a question has been played and responses recorded, the charts/results can be viewed by
pressing the charts button on the presentation toolbar shown above. Below is an example of the
results window. There are 3 views available: -
Bar Chart
Pie Chart
Grid View
Play/Stop question
New Question
Replay Question
View charts/results
End Set Question presentation