Phase 6 – viewing reports and charts in classcomm – Genee World ClassComm User Manual
Page 35
35
Phase 6 – Viewing Reports and Charts in ClassComm
Charts and Reports are generated when a RECORD ASSESSMENT presentation has been saved. In
ClassComm 4.0.0 and above, reports and charts are also saved with SURVEY mode presentations.
However, when running survey mode note that only 4 of the 6 available reports will be viewable:
Class Answer Report A
Class Answer Report B
Student Report B
Question Summary Report
To view reports, go to the REPORTS section of ClassComm. On the left-hand side of the interface is
the report settings panel – see following image.
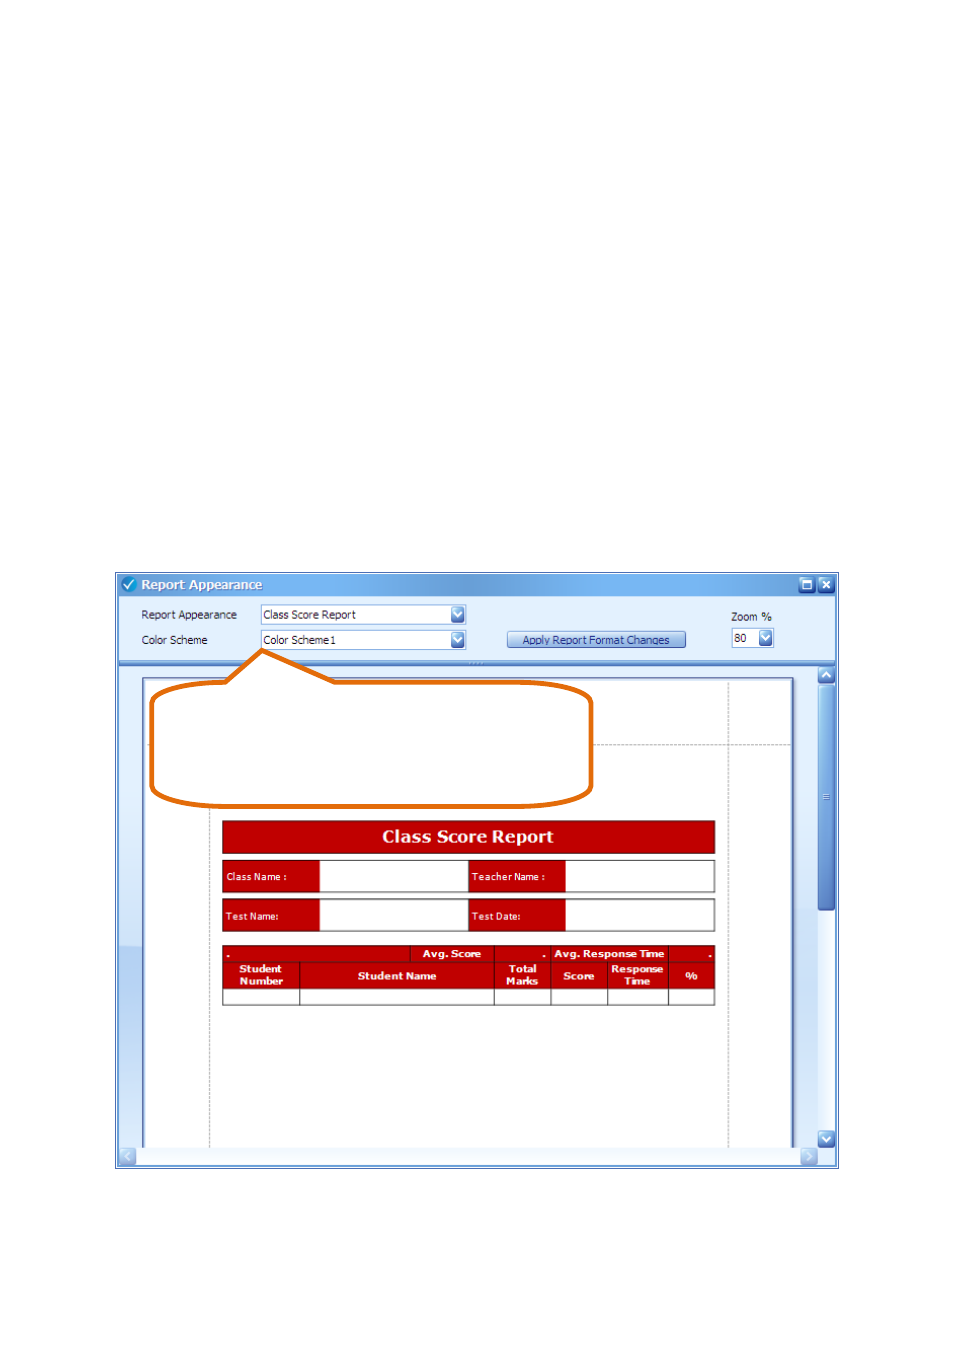
Also, the default report appearance can be changed by the user by opening Settings > Report
Appearance:
Select the Report Appearance and Colour schemes.
A preview will be displayed. Click the “Apply Report
Format Changes” button to save the changes.