Performance monitoring, E1/t1 statistics – GAI-Tronics LE300-IP Page/Party Line Extender User Manual
Page 60
Pub. 42004-488C
M
ODEL
LE300-IP
P
AGE
/P
ARTY
®
L
INE
E
XTENDER
P
AGE
57 of 68
e:\standard ioms - current release\42004 instr. manuals\42004-488c.doc
09/14
Performance Monitoring
The IPmux-24 provides performance monitoring tools, which consist of the following three levels:
1. E1/T1 statistics - Status of the physical E1/T1 parameters (signal, framing, etc.)
2. Ethernet statistics - Ethernet connection status (speed, duplex mode, bytes transmitted & received,
etc.).
3. Bundle connection statistics - PW bundle connection status on the PSN level.
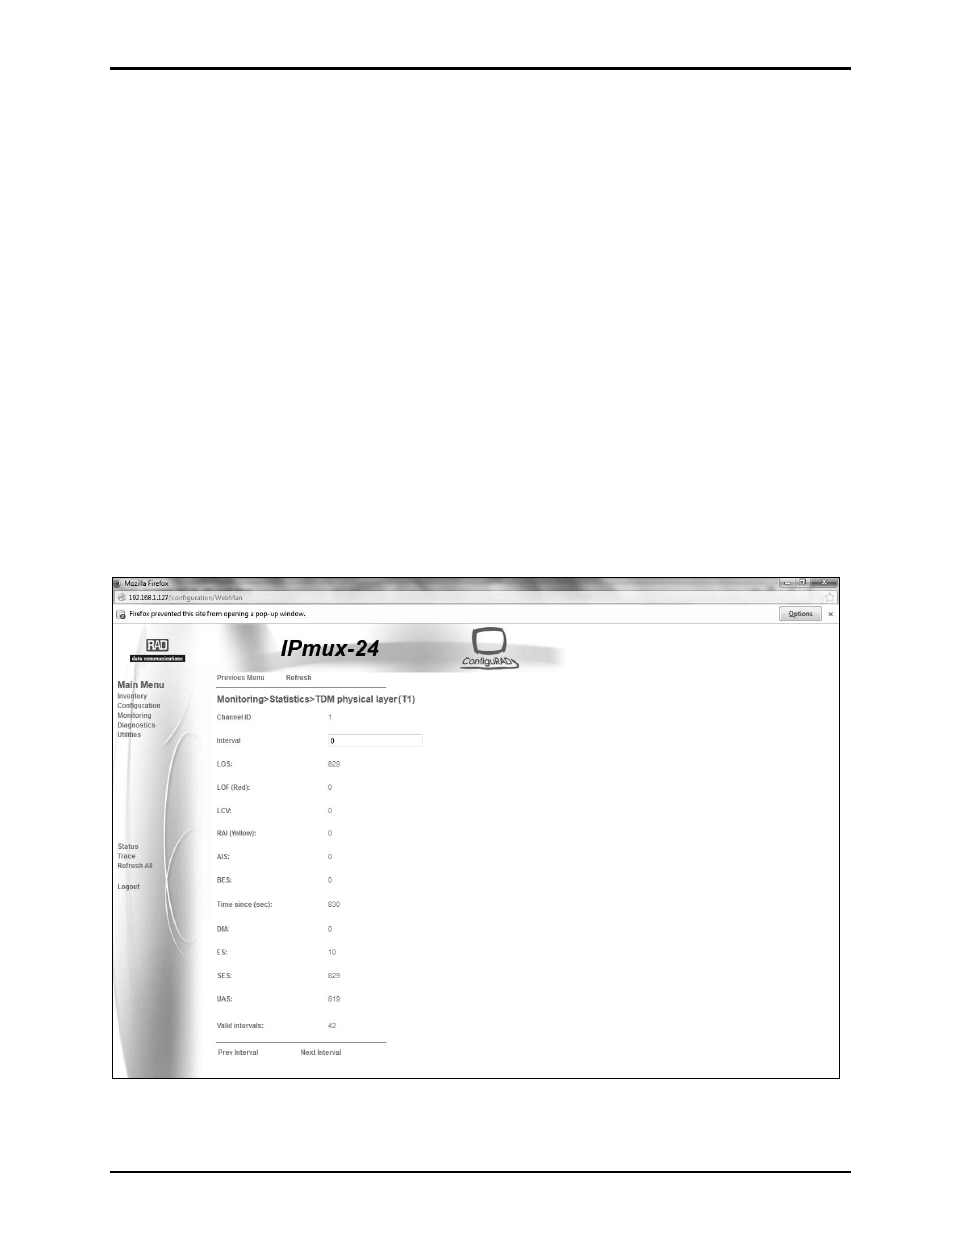
E1/T1 Statistics
E1/T1 statistics refer to the physical status of the E1/T1 traffic reaching IPmux-24 from the adjacent E1/T1
device. E1/T1 statistics are monitored and saved under consecutive intervals. Each interval is 15 minutes
long. There are 96 intervals, which represent the last 24 hours. Whenever a new interval is started, the
counters are reset to zero. The old interval shows the total of events that occurred during its 15-minute
period.
The current active interval is always marked as interval 0 (you will see that the Time Since counter is
running). The previous interval is marked as 1, and so on. The E1/T1 statistic counters cannot be reset
manually.
From the Monitoring menu (Statistics> TDM Physical Layer> T1):
Enter the number of the interval whose statistics you wish to display, and press E
NTER
.