Fluke Biomedical 07-444 User Manual
Page 27
Setup
D log E Setup
4
4-13
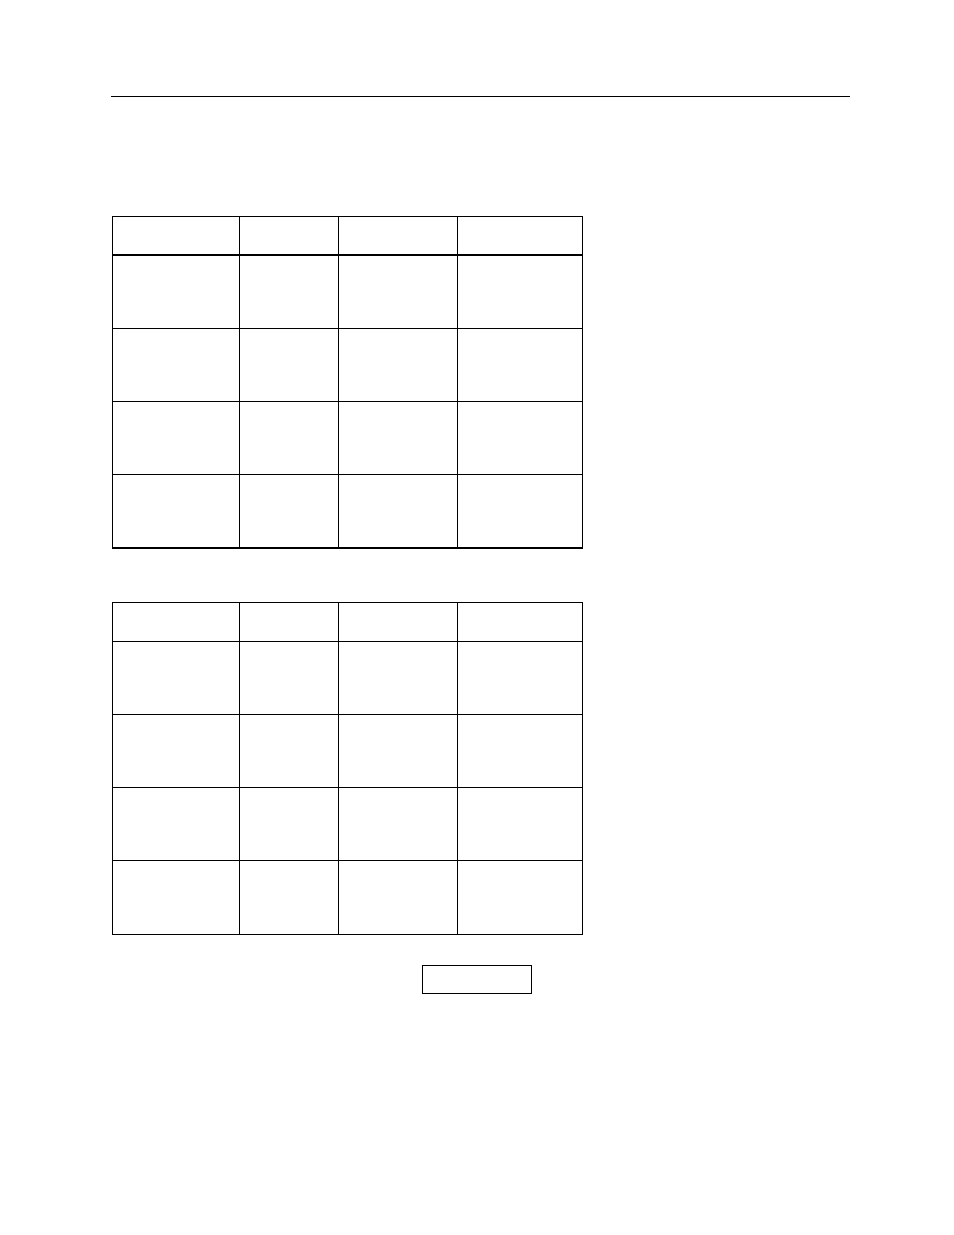
This procedure allows the user to setup, maintain, and selectively clear the control chart files. The setup
of these files includes the automatic (Scan New Params) or manual (Enter New Params) entry of the
following parameters in Tables 4-1 and 4-2.
Table 4-1.
Index Chart File
Chart Item
Range
Default
Setting
Contrast Index
Baseline
Deviation
0.00 - 4.00
0.02 - 3.98
(1)
1.25
0.15
Speed Index
Baseline
Deviation
0.00 - 4.00
0.02 - 3.98
(1)
1.00
0.15
Base + fog
Baseline
Deviation
0.00 - 4.00
0.02 - 3.98
(1)
0.20
0.02
Max. OD
Baseline
Deviation
0.00 - 4.00
0.02 - 3.98
(1)
3.00
0.15
Table 4-2.
Gradient Chart File
Chart Item
Range
Default
Setting
Average
Gradient
Baseline
Deviation
0.00 - 9.99
0.02 - 9.97
(1)
2.00
0.15
Relative speed
Baseline
Deviation
0.00 - 3.00
0.02 - 2.98
(1)
1.00
0.15
Base + fog
Baseline
Deviation
0.00 - 4.00
0.02 - 3.98
(1)
0.20
0.02
Max. OD
Baseline
Deviation
0.00 - 4.00
0.02 - 3.98
(1)
3.00
0.15
The deviation range is dependent on the baseline
value; the deviation must be less than half the
baseline value. This limit allows the control chart to
contain two deviation intervals above the baseline
and two below the baseline.
NOTE