T5 t9 – KLING & FREITAG K&F ACCESS T9 User Manual
Page 48
User’s Manual
ACCESS SYSTEM
KLING & FREITAG GMBH ©1995-2009
Version 6.0, 17.03.2009
Page 48 of 60
15.
Sound Pressure Dispersion of Mid-High Systems T5 & T9
Be aware of the fact that the logical targeted alignment of this high quality speaker
system can lead to a significant qualitative increase in the acoustic result. It is not possi-
ble to make generalities about the alignment of specific systems because the room has a
substantial influence on the signal and the audible result.
To simulate the correct alignment of the speakers beforehand, there are various pro-
grams such as ‘‘Ease‘‘, ‘‘Ulysses‘‘ or ‘‘CADP 2‘‘. The Kling & Freitag speaker system data
for downloads is available on our homepage ‘‘www.kling-freitag.de‘‘.
The following graphics will assist in making a rough estimate as to the level distribution
of the ACCESS System’s mid/high systems. The graphics only take into consideration the
sum of the direct sound and not the influence of the room. The listening level is at 1.2
m. Because of this there can, in some cases, be noticeable deviation.
1 x T5: SPL Peak 143 dB (1W/1m) direct sound level
1
43dB
137dB
131dB
125dB
119dB
113dB
2m 4m
8m
16m
32m
50
109dB
1 x T9: SPL Peak 139 dB (1W/1m) direct sound level
13
9dB
13
3d
B
12
7d
B
12
1d
B
11
5d
B
10
9d
B
2m 4m
8m
16m
32m
50
10
5d
B
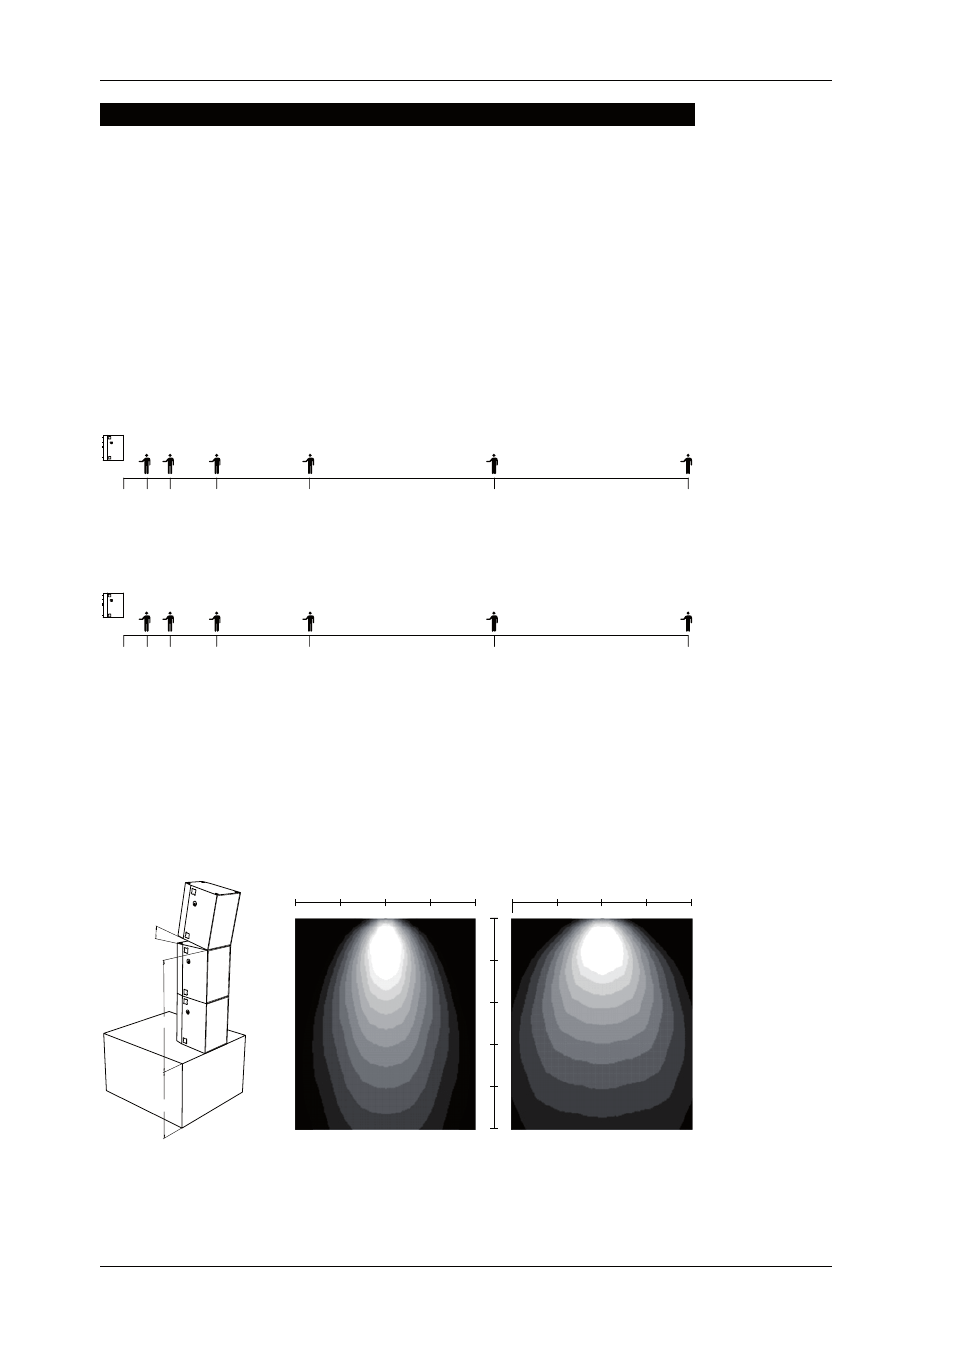
Graphic illustration of the dispersion coverage of ACCESS T5 and T9 (4 kHz)
Based on the graphics shown here, it is clear that the more narrowly distributing system
T5 carries more acoustic pressure at the bottom than the broadly dispersed ACCESS T9.
The horizontal sound distribution of the T5 loudspeaker, especially in the near field, is
not as homogeneous as with the T9 system. The T9 system has a more gradual sound
dispersion. These varying properties can be taken advantage of and combined for spe-
cific uses.
T5
T9
St
ag
e
1,2
m
1,8m
10°
10
10
20
30
40
20
30
40
50
10
20
30
40
m