Turning Technologies Mobi User Manual
Page 35
Mobi 360
35
1
Start a Verbal, Tagged or ExamView question in the Question Zone.
2
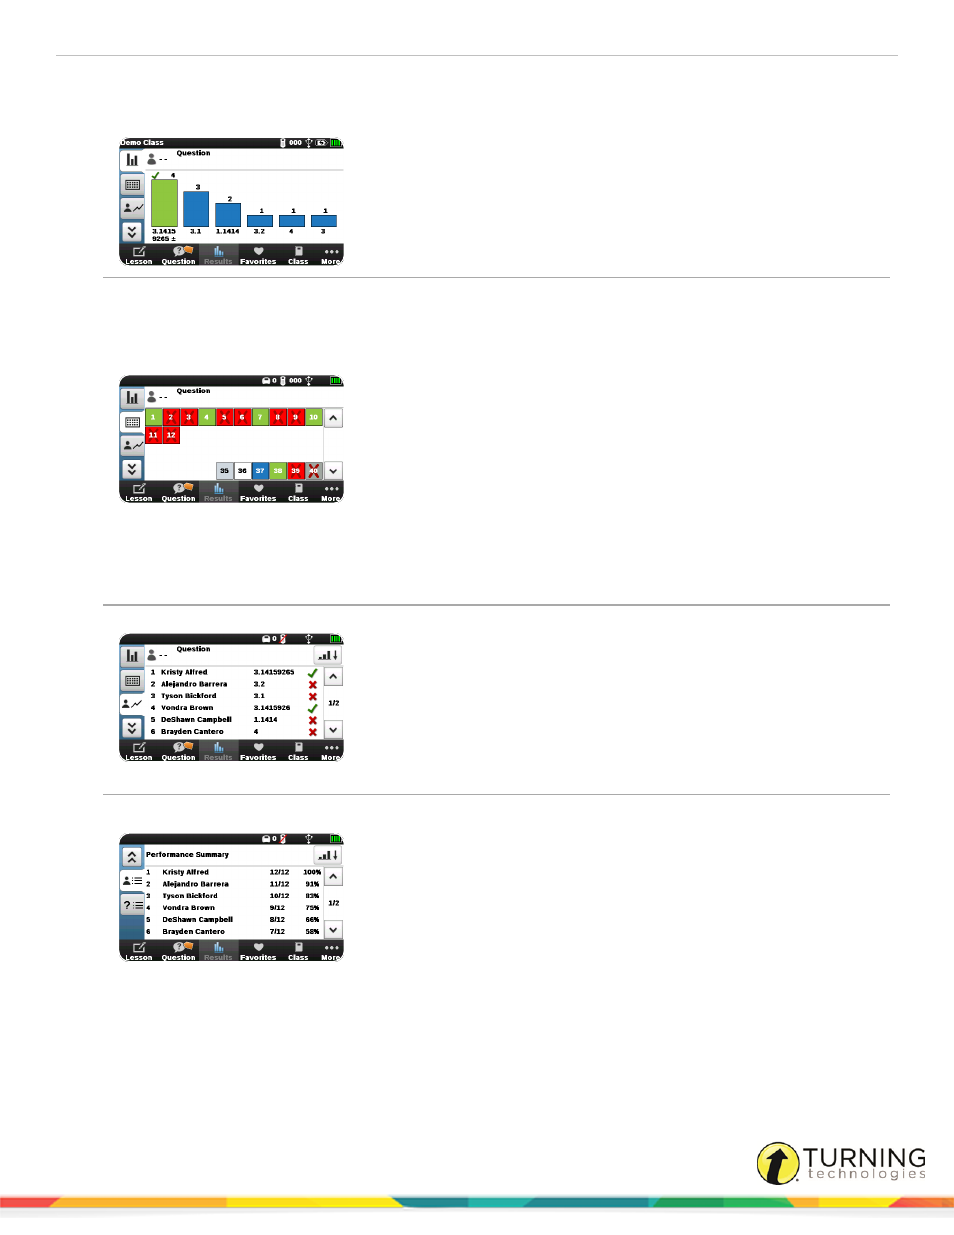
Tap Results, or from the Results Zone, tap the desired tab.
The
Response Distribution Chart
displays the number of student responses for
each answer choice in the most recent question and is compatible with all
supported question types. The chart provides a summary of student responses
for an individual question and can be displayed on the classroom computer
desktop.
You can display this chart on-screen for students.
The
Student Response Grid
is compatible with all supported question types and
provides a color-coded grid of individual student responses for the current
question.
The total number of students who have answered the question is displayed in
the upper-left corner and automatically updates as students enter responses.
The Student Response Grid displays four rows of 10 student boxes by default;
more than 40 students can be viewed by using the scroll bar. The Student
Response Grid also displays the connected student response devices.
The Student Response Grid cannot be displayed on the classroom computer
screen.
White - Student on class roster but has not joined the session.
Gray - Student response pad is connected.
Gray with red “X” - Pad was connected but has disconnected.
Green - Student entered correct response or responded to a poll question (no
correct answer).
Red with gray “X” - Student entered incorrect response.
The
Student Performance Table
lists question responses by student name and
is compatible with all supported question types. Icons indicate whether each
answer is correct or incorrect. A series of dashes indicates that a connected
student has not yet responded to the question. The list can be sorted by student
response pad number, correct responses or incorrect responses.
To sort the information, tap the
Sort
icon then tap the button matching the type
of sort you want to see.
The table will appear slightly different for short answer questions to
accommodate the responses.
The
Performance Summary
displays the student name, number of correct
answers and percentage of correct answers. The list can be sorted by student
response pad number, lowest score or highest score. The Performance
Summary is similar to the Student Performance Summary report on the Insight
360 software’s My Results tab.
Six students are displayed; use the scroll bar to view additional students.
Anonymous students have score of zero (0) even if they answer the question
correctly.
The Performance Summary cannot be displayed on the classroom computer
screen.
turningtechnologies.com/user-guides