Parr Instrument 6772 User Manual
Page 33
6772
Calorimetric Thermometer Instruction Manual
5-7
Cold Restart:
This is essentially the same as cycling power on the unit. All valid test data will be retained
during this cold restart procedure.
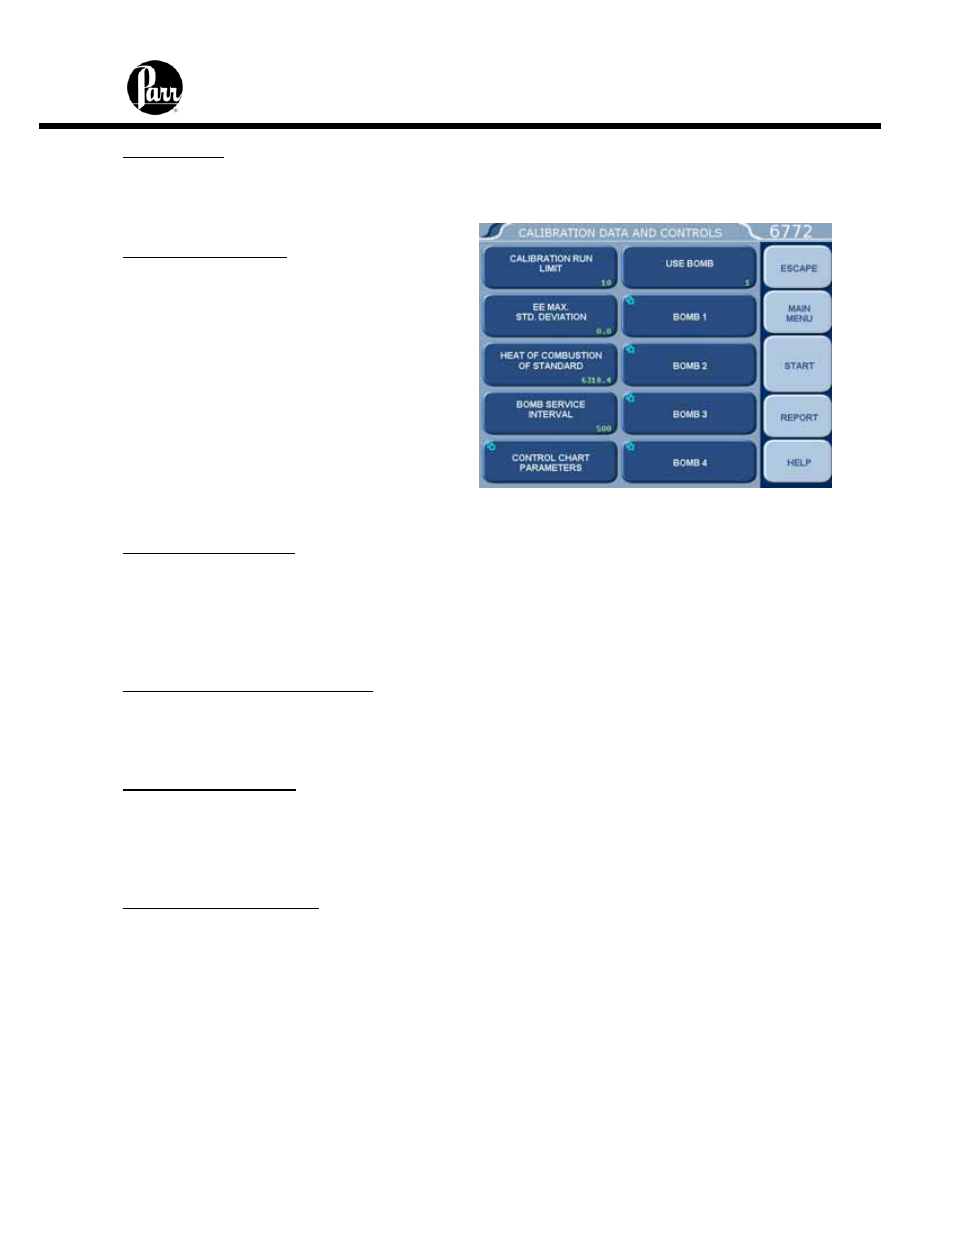
Calibration Data and Controls Menu
Calibration Run Limit:
Displays the maximum number of runs that
will be included in determining the EE value
of a bomb and bucket combination and
accesses the sub-menu on which this limit is
set. Most test methods suggest 10 tests.
Tests in excess of the most recent ones
used are still available but are not used in
the calculation of the EE value. For example
if 11 standardization tests have been run, the
calorimeter will only use the most recent 10.
The 11
th
is still stored in the memory and is
available for view or printing. Only runs that
are at final status will be used in this calculation.
EE Max Std Deviation:
Displays the maximum relative standard deviation in percent that will be permitted
for any EE value calculated by the Calorimetric Thermometer and accesses the sub-
menu on which this limit is set. If this value is exceeded, the user will be warned to
take corrective action before proceeding with testing. A setting of zero disables this
check.
Heat of Combustion of Standard:
Displays the heat of combustion in calories per gram for the material used to standardize the
Calorimetric Thermometer and accesses the sub-menu on which this value is set. For
benzoic acid, this value is 6318.4 calories per gram.
Bomb Service Interval:
Displays the maximum number of times a bomb may be fired before it is flagged as due for
service and accesses the sub-menu on which this limit is set. Parr recommends 500 firings
for this service interval. (Parts may need to be replaced on a more frequent basis depending
upon the nature of the sample).
Control Chart Parameters:
A control chart is a graphical tool which can assist the user in determining whether or not
their process is in control. Many standard methods will dictate that a reference sample be
measured periodically and the results plotted on a graph. Limits for acceptable values are
defined and the process is assumed to be in control as long as the results stay within these
limits. Since results are expected to scatter with a normal distribution within established
limits, systematic trends or patterns in the data plots may also be an early warning of
problems.
• Charted
Value:
Toggles the charted value between the HOC Standard (Heat Of Combustion of
Standard) and Energy Equivalent.