Noise floor, Statistics – EXFO ARU-100 HPNA Test Probe User Manual
Page 14
HPNA Tests
9
Noise Floor
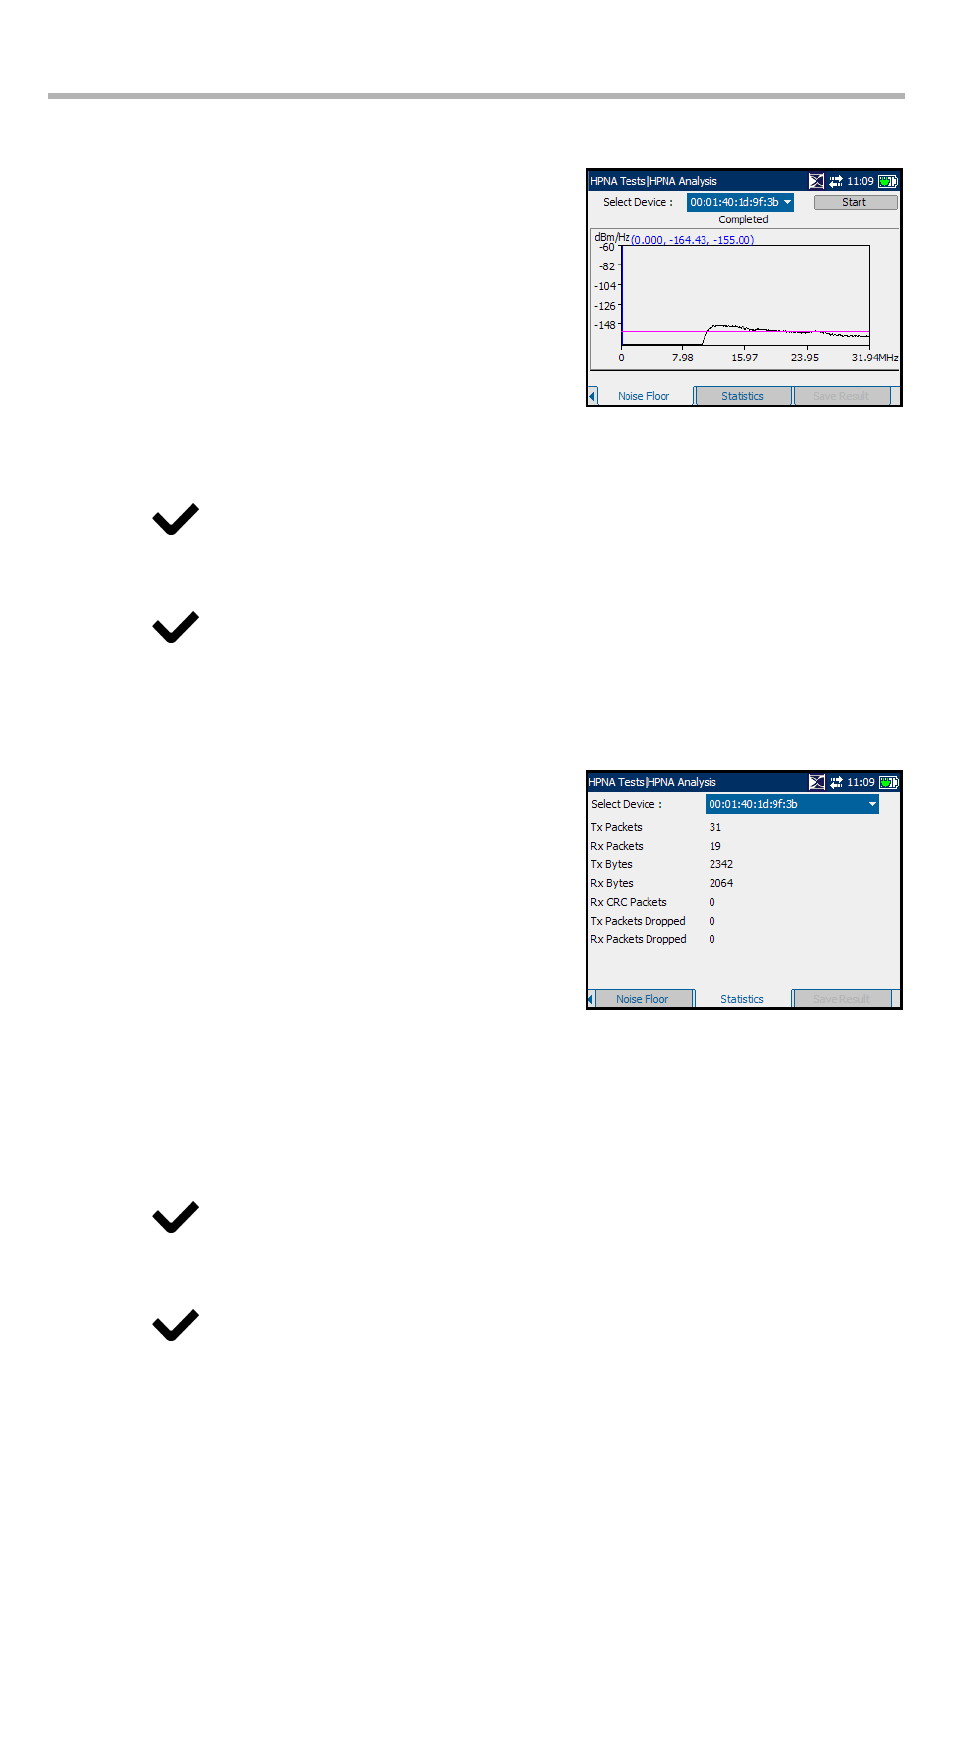
The Noise Floor tab displays a plotted graph of
Frequency/NoiseFloor(dBM) depicting the measure
of noise level in the setup when no traffic is present
on the wire. This test triggers 32 noise
measurements for the selected device and collects
data samples.
³
Select Device lists all the MAC addresses of the
detected HPNA devices on the network.
³
The red line represents the Max Noise threshold that you selected during the
Configure Tests. Values were -140, -145, -150, or -155 dBm/Hz.
To select a MAC address:
1. Press
to open the list.
2. In the list, press the up/down arrows to select the MAC address of the desired
device.
3. Press
to confirm the selection and view the results.
Start button tests the noise floor of the selected device.
Statistics
The Statistics tab allows you to view counter
statistics of the selected HPNA device.
³
Select Device lists all the MAC addresses of the
detected HPNA devices on the network.
³
Tx Packets is the number of packets sent.
³
Rx Packets is the number of packets received.
³
Tx Bytes is the count of bytes sent.
³
Rx Bytes is the count of bytes received.
³
Rx CRC Packets is a count of cyclical redundancy check(CRC) errors received.
³
Tx Packets Dropped is the number of outgoing packets dropped.
³
Rx Packets Dropped is the number of incoming packets dropped.
To select a MAC address:
1. Press
to open the list.
2. In the list, press the up/down arrows to select the MAC address of the desired
device.
³
Press
to confirm the selection and view the test results.