頁面 61, X-y mode applications, Fig.18 phase measurement x-y operation – Elenco 30MHz Dual Trace User Manual
Page 61
58
APPLICATION
X-Y MODE APPLICATIONS
(Refer to Fig.17)
A dual-trace method of phase measurement was previously described. A second
method of phases measurement requires calculations based on the Lissajous
patterns obtained using X-Y operation. Distortion due to non-linear amplification can
also be displayed.
A sine wave is applied to the audio circuit being tested. The same sine wave is also
applied to the vertical input of the oscilloscope, and the output of the tested circuit is
applied to the horizontal input of the oscilloscope. The amount of phase difference
between the two signals can be calculated from the resulting waveform.
1. Using an audio generator with a pure sinusoidal signal, apply a sine wave test
signal at the desired test frequency to the audio network being tested.
2. Set the signal generator output for the normal operating level of the circuit being
tested. If desired, the circuit's output may first be observed on the oscilloscope
with normal sweep operation. If the test circuit is overdriven, the sine the signal
level must be reduced.
3. Connect channel 2 to the input and channel 1 to the output of the test circuit. Set
channel 1 and 2 gain controls for exactly the same amplitude waveform on the
display in normal sweep operation.
4. Select X-Y operation by pressing the X-Y switch.
5. If necessary, repeat step 3, readjusting the channel 1 and 2 gain controls for a
suitable viewing size. Some typical results are shown in Fig.17
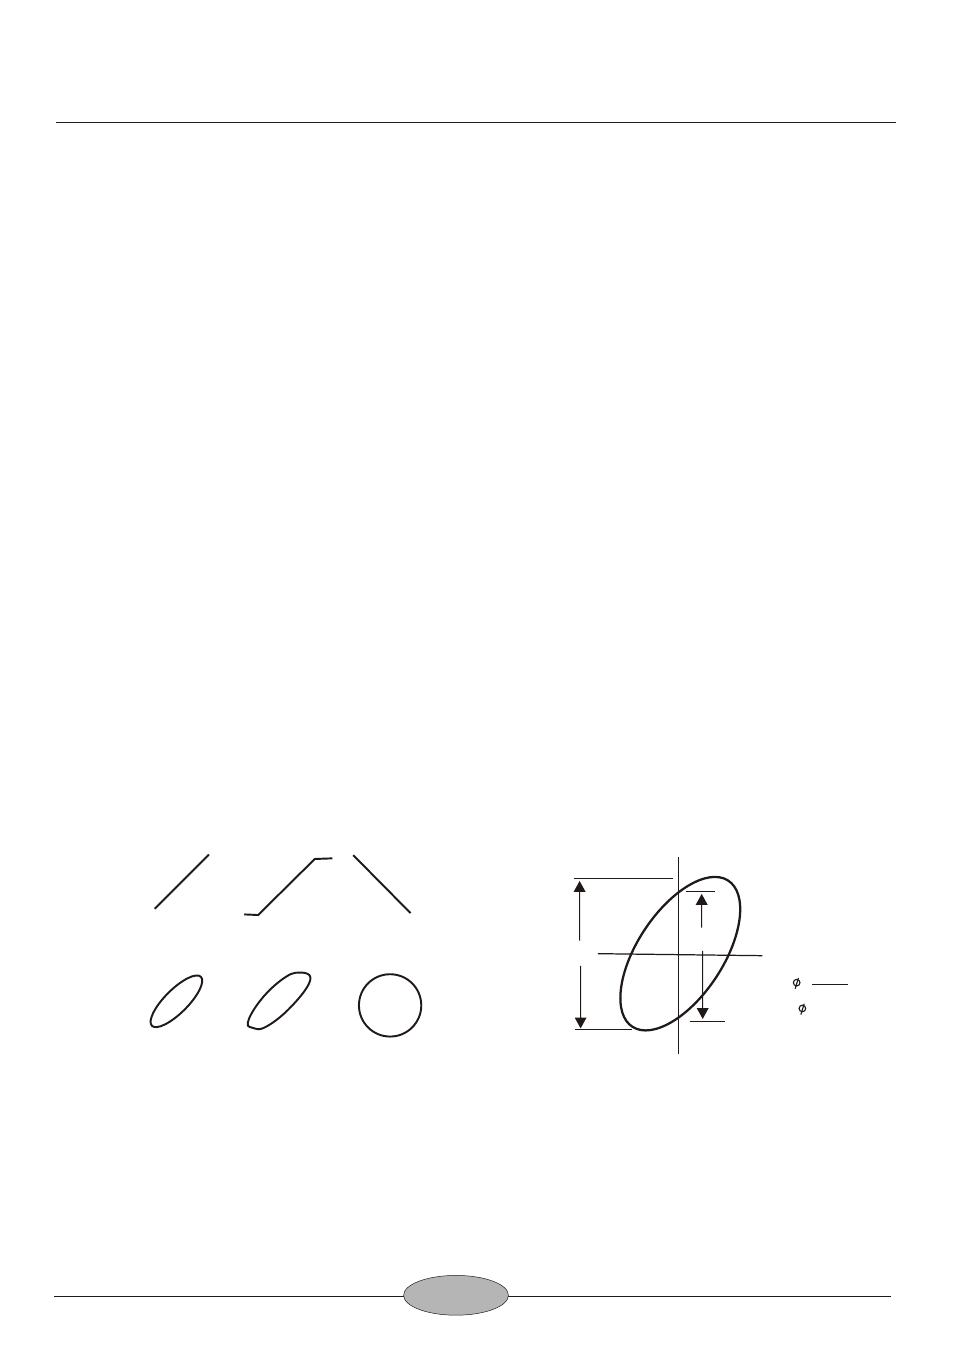
If the two signals are in phase, the oscilloscope trace is a straight diagonal line. If the
vertical and horizontal gain is properly adjusted, this line is at a 45 angle. A 90
phase shift produces a circular oscilloscope pattern. Phase shift of less (or more)
than 90 produces and elliptical oscilloscope pattern. The amount of phase shift can
be calculated from the oscilloscope trace as shown in Fig.
.
°
°
°
18
Fig.17 Typical X-Y Phase Measurement Display
No amplitude distorion
not out of phase
Amplitude distorion
not out of phase
180 out of phase
A
B
SINE =
Where = phase angle
B
A
Fig.18 Phase Measurement
X-Y Operation
No amplitude distorion
out of phase
Amplitude distorion
out of phase
90 out of phase