Vernier DataMate Guidebook User Manual
Page 29
DataMate Guidebook
27
The first five options will display the current value for that variable and
prompt you for a new value. Each time a variable is changed, the
calculator regraphs the data and the model equation. Option 6 will turn off
the model and return you to the
ANALYZE MENU
screen. The parameters
are reset upon leaving modeling.
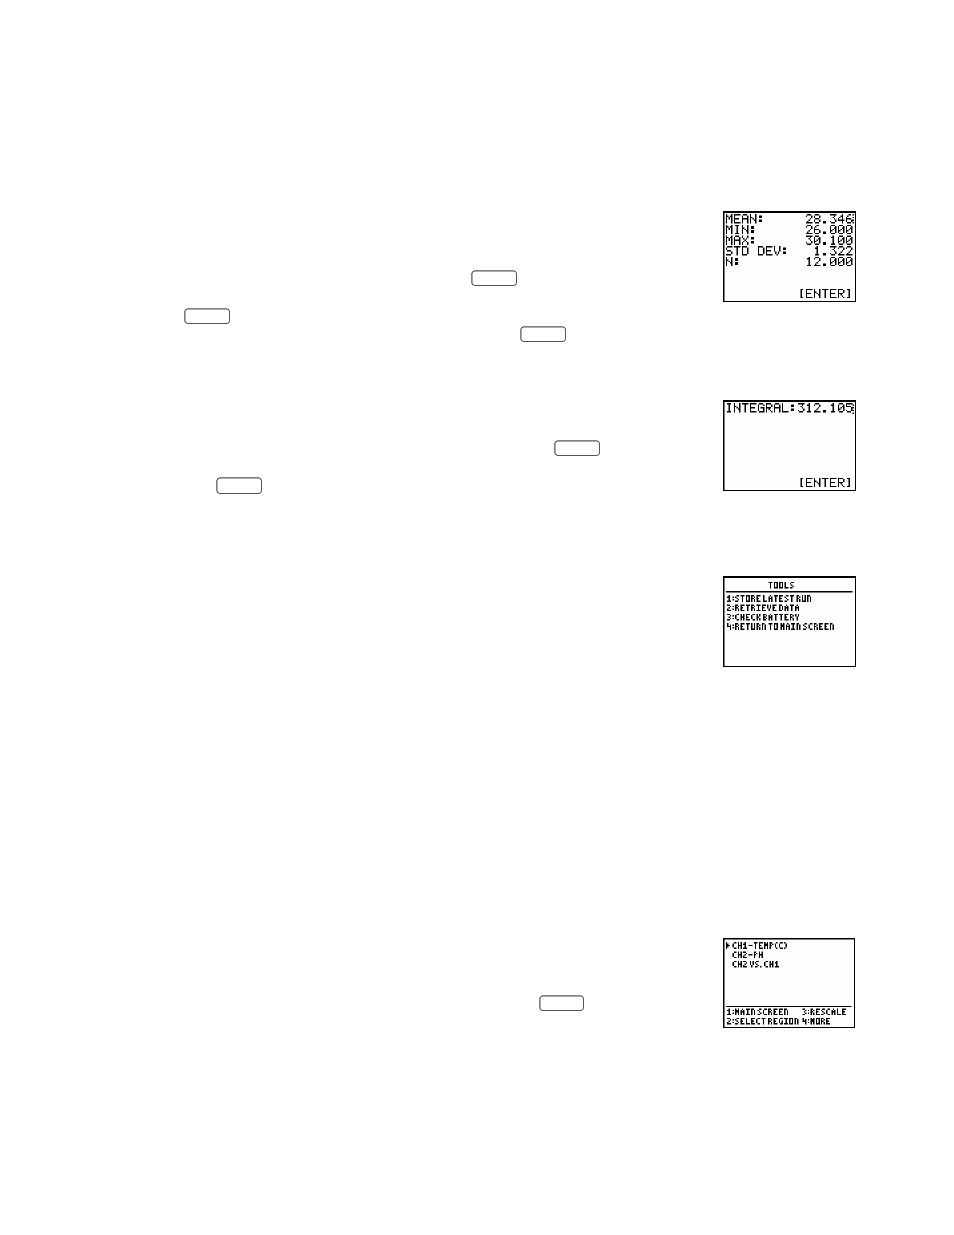
STATISTICS
finds the mean, min, max, standard deviation, and number
of data points of a selected region. After selecting this option, choose a
graph from the displayed list. Use the arrow keys to move the cursor and
select the left bound of the region and press
ENTER
. A vertical line will be
drawn on the graph. Now move the cursor to select the right bound and
press
ENTER
. After the calculator has finished determining the statistics, a
message will be displayed instructing you to press
ENTER
to continue. The
numerical results will be displayed. No data are deleted in calculating
statistics.
INTEGRAL
is used to integrate a section of the graph. After selecting this
option, choose a graph from the list. Use the arrow keys to move the
cursor and select the left bound of the region and press
ENTER
. A vertical
line will be drawn on the graph. Use the cursor to select the right bound
and press
ENTER
. The numerical results will be presented.
TOOLS OPTION
When Tools is selected from the Main screen, the screen to the right
appears.
After data collection, data is automatically stored in lists. For example,
time is stored in List 1 (L
1
) and the temperature (data) in List 2 (L
2
).
Subsequent data collections will overwrite those lists with the current data.
You do, however, have the option to store the data (from List 2) so it won’t
get overwritten. Note that L
1
will not be stored. Selecting
STORE LATEST
RUN
stores the previous data into List 3 so List 2 becomes free for more
data. In other words, List 3 (L
3
) becomes List 4 (L
4
), List 2 (L
2
) becomes
List 3 (L
3
). List 2 is then available for another run.
Note:
This feature can only be used if one sensor is active in CH 1. It can only store two previous runs.
The third run remains in List 2 (L
2
).
RETRIEVE DATA
. The Retrieve Data option is used to download data after remote data
collection.
•
From the
TOOLS
screen, select
RETRIEVE DATA
.
•
You will get a message “Retrieving Data.”
•
Arrow to the data set you want to view and press
ENTER
. Follow the
directions for viewing a graph.