Vernier DataMate Guidebook User Manual
Page 28
DataMate Guidebook
26
•
Press
ENTER
and return to the
RESCALE GRAPH
screen and select
another scale to see the graph with other scale options.
•
When you are done viewing the graphs, press
ENTER
to return to the
Rescale Graph screen, then select
RETURN
.
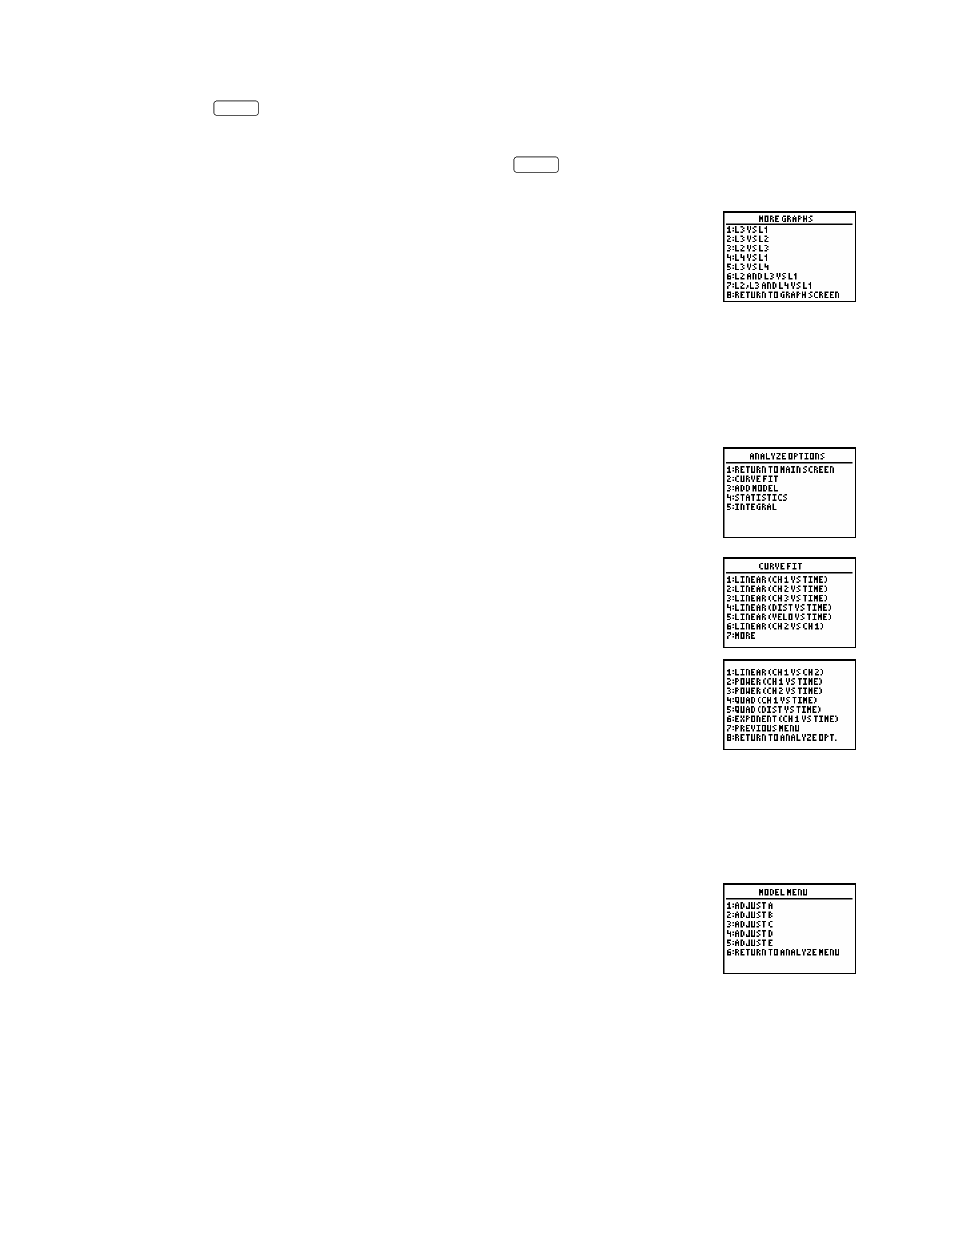
Selecting
MORE
on the Graph screen enables you to plot alternate data
lists in a graph.
L1, L2, L3 and L4 refer to the lists in which your data are stored. For
example, L3 vs. L1 will graph the data in List 3 versus the data in List 1.
If multiple channels are shown, then the point, box and plus point
protectors are used for lists L2, L3, and L4 respectively.
ANALYZE OPTION
The
Analyze
option on the Main screen produces this list of options. You
can perform a curve fit, model data with a function other than curve fit
functions, determine statistics over a region of data, and determine the
integral over a region of data.
Selecting
CURVE FIT
from the
ANALYZE OPTIONS
menu produces a list
of curve fit options. Selecting
MORE
produces another six options.
After a curve fit is performed, the fit parameters are displayed. Next, the fitted curve is drawn as
a continuous line, and the data points are shown with box point protectors.
Note that the t=0 point cannot be included in power law curve fits. Use the select region option
to remove the first point.
ADD MODEL
graphs the collected data and overlays a graph of a general
equation whose variables can be adjusted. Before choosing this option, it
is necessary to quit DataMate and manually enter the general equation to
be used into the Y1 equation variable. The equation may use the
parameters A, B, C, D, and E as a function of X. When you select the
ADD
MODEL
option, you will be asked to choose which graph you would like to
view along with the model. The calculator will display a graph, then bring
up the menu to the right.