Vernier DataMate Guidebook User Manual
Page 27
DataMate Guidebook
25
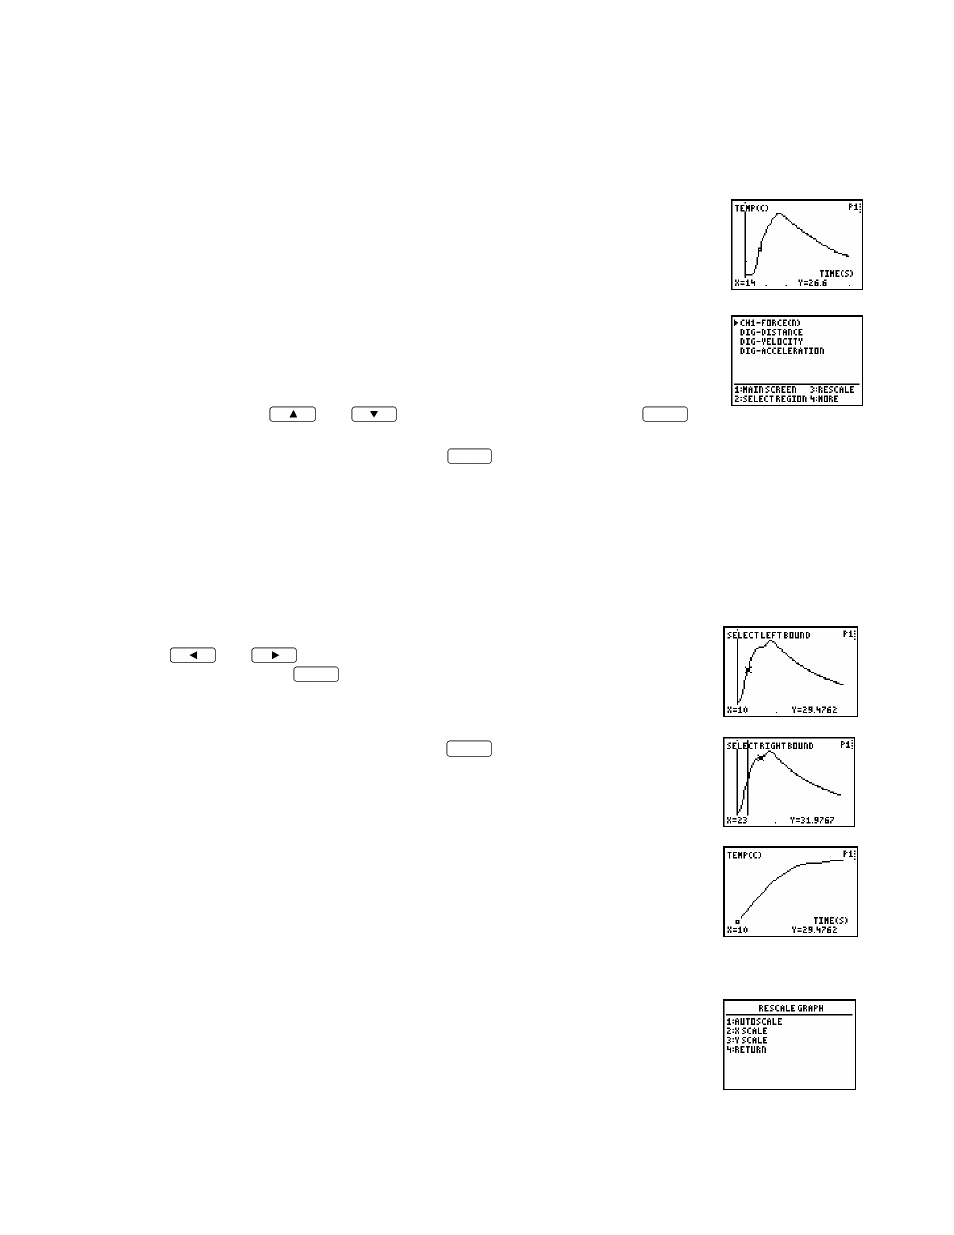
GRAPH OPTION
The
Graph
screen automatically appears when you are finished collecting data or when
Graph
is
chosen from the Main screen. Two conditions determine the
Graph
screen:
•
If one analog channel is active then a graph of your data is presented
when data collection is complete, or if two of the same type of analog
sensors are plugged in.
•
If more than one channel is active or you have collected data using the
motion detector, you will be presented with a list of available channels
to view. To view a graph, select the appropriate channel from the list
by using the
and
keys on the calculator and press
ENTER
.
If you want to view another graph, press
ENTER
. The Graph screen appears again so you can
choose another channel.
Selecting
MAIN SCREEN
on the Graph screen will take you back to the Main screen.
SELECT REGION
on the Graph screen is used to remove unwanted data from lists, i.e. data
that are outside the region of interest. This option may be necessary for curve fitting. Data
outside the selected region are permanently deleted.
•
Select the left bound, as viewed on the bottom of the screen, using the
and
keys. When the values you want for the left bound is
displayed, press
ENTER
.
•
Repeat for the right bound and press
ENTER
.
•
The new graph will automatically be displayed.
RESCALE
is used to autoscale, adjust the x-axis or y-axis scaling of your graph.
•
Press the number beside the scale you wish to change. You will be
prompted to enter the minimum, maximum, and tic mark interval for
the selected axis.