Vernier Spectro Pro User Manual
Page 44
Spectro Pro Reference
46
Spectro Pro
Graph Column On
The calculated column can be graphed on either axis. The default choice
is the y axis. Click the x-axis label to plot the new column on the
horizontal axis.
Try New Column
Clicking the Try New Column button will graph the new column in the
sample graph. You can make changes to the definition, and check out the
changes by clicking this button again. Click OK to keep the new column
and return to the main Spectro Pro screen. Cancel will close the dialog
box and discard any entries.
Manual columns only require a name. The new column will be created
in the data table. Select a cell by clicking it. Type in your values, ending
each entry with the enter or return key. You can also paste a column of
data after clicking the first cell. Manual columns are limited to the
number of data points already collected using a sensor.
Modify Column allows you to change the definition of a calculated
column. The same dialog box as for New Column above is displayed.
Use Delete Column to remove unneeded columns.
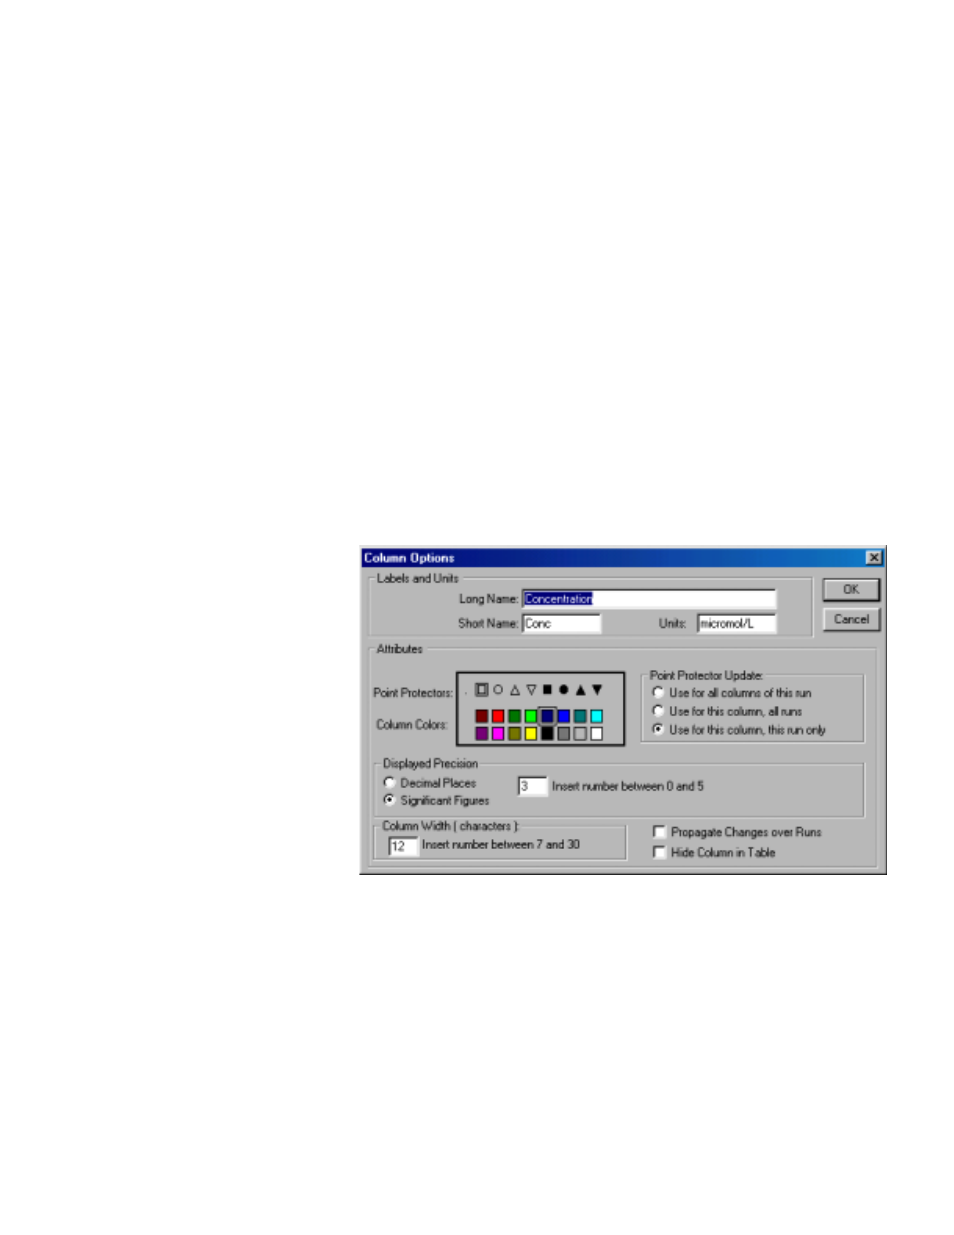
Column Options opens a dialog in which you can change the name of
the column, change the point style used, units, and displayed precision
of data. Use this option to modify existing columns.
Clear All Data removes all data from the data table. You will be
prompted to save any unsaved data.
New Column
Ж
Ж
Manual
Modify Column
Delete Column
Column Options
Clear All Data