Cursor controls – Vernier Spectro Pro User Manual
Page 32
Spectro Pro Reference
34
Spectro Pro
You can quickly see what a tool does by positioning the pointer over the
button for a moment; a tool tip will appear.
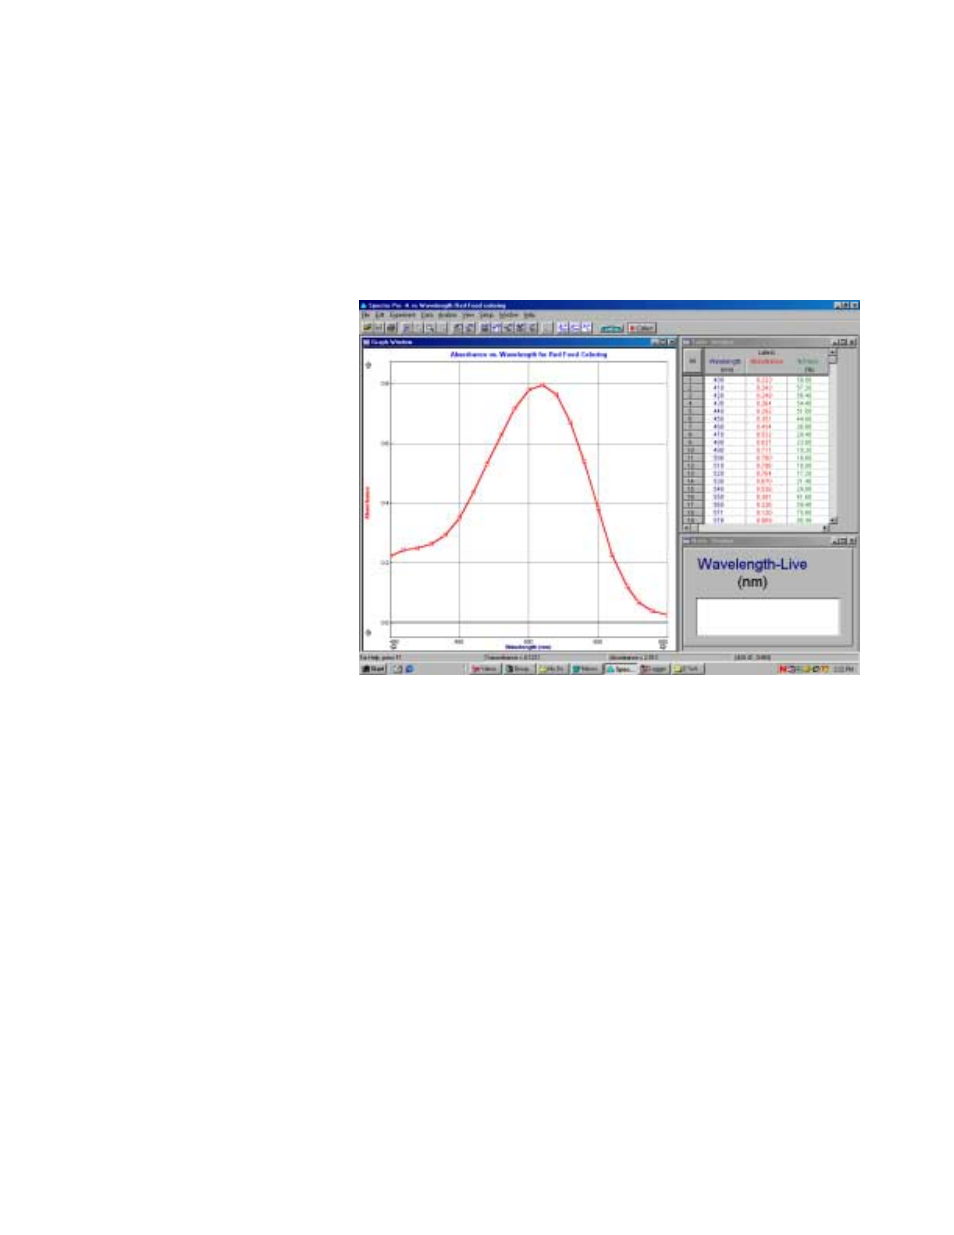
Cursor Controls
You can change the graph appearance and behavior through a number of
“hot spots” on the Graph Window and the Table Window. The screen
below shows some of these functions.
These areas of the Graph Window are active to cursor control:
Click on the graph title to obtain a dialog box in which you can modify
or remove the graph title.
You can click on the minimum or maximum axis numeric labels and
type in a new value. The axis of the graph will change accordingly.
When the independent variable is time, the right-most time value will
also determine how long data are collected except when the graph has
been turned into a strip chart.
Clicking an axis label will open a dialog box that allows you to choose
what is plotted on that axis.
You can scroll the viewing region of the graph with the scroll arrows.
The axis limits will change, but the interval displayed by each axis will
remain the same.
To change the scale of one axis at a time, click on the area between the
axis and the axis label. A dialog box will open, allowing you to control
the scaling of that axis.
Graph Window
Graph title
Tick mark labels
Axis labels
Scroll arrows
Axes