Vernier Spectro Pro User Manual
Page 33
Spectro Pro Reference
Spectro Pro
8
Double-click on a graph to change several properties at once. The Graph
Options dialog will appear; allowing you to change scaling, labels, or
plot style. More details can be found under Graph Options in the Spectro
Pro Menus section.
If there is more than one graph window on the screen, most commands
that affect graphs will change only the selected graph window. To select
a graph, click on it. A border will appear around the graph to indicate
that it is selected.
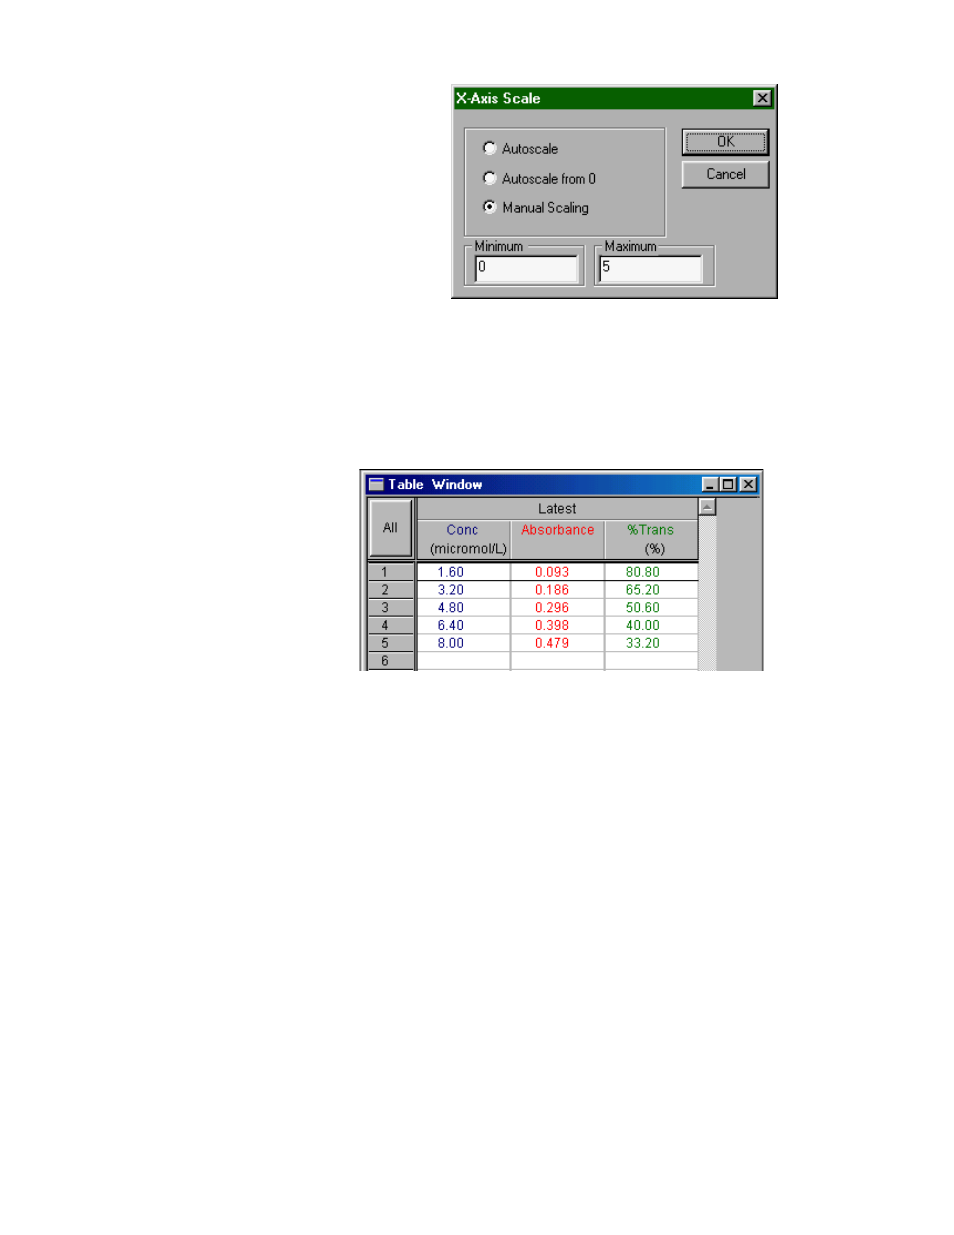
The Table Window also responds to clicks:
Clicking the All/None button will alternately select all data and no data.
Double-clicking the row numbers will open the Table Options dialog.
There you can change the font used and choose which columns will be
displayed.
Double clicking the Run Heading (Latest, Run 1, and so forth) will open
a dialog box holding a list of columns. Select a column, click on OK,
and the Column Options dialog for the chosen column will open.
Double-clicking a specific column header will open its Column Options
dialog directly. You can find more details about Column Options under
the Data menu details below.
To rearrange the order of displayed columns, drag the column header to
the desired position.
Only cells in manually entered columns or prompted columns collected
in Events with Entry mode can be edited. Click the cell to be changed.
Type in the new value, and press enter.
To ignore spectrophotometer-collected data (which is not editable),
select the data range in the table and choose Strikethrough Rows from
the Edit menu. Selecting stricken-through rows in the table and choosing
Restore Rows from the Edit menu restores this data.
Graph options
Selecting a graph
Table Window
Select All/None
Column properties
Column options
Column order
Edit cell contents
Strikethrough Rows