Bendix Commercial Vehicle Systems ACom Diagnostics V.5.9 User Manual
Page 13
13
Control Buttons
Start
Begins calibration
Stop
Stops calibration
Yes
Acknowledges condition needed
to continue
No
Allows condition to be met
Cancel
Stops calibration
Close
Closes dialog
Wheel Speed Screen
This screen allows the user to monitor wheel speeds.
Along with this functionality, the user has the ability to
perform data acquisition of the wheel speeds and save
the results to a comma delimited fi le. The wheel speeds
may be monitored both graphically and numerically.
Figure 37
Manipulating Graphs
The user is able to display graphical data in either line
or bar graph form. It is possible to switch between the
two types of graphs through the “Graph Type” region of
the wheel speed screen.
Figure 38
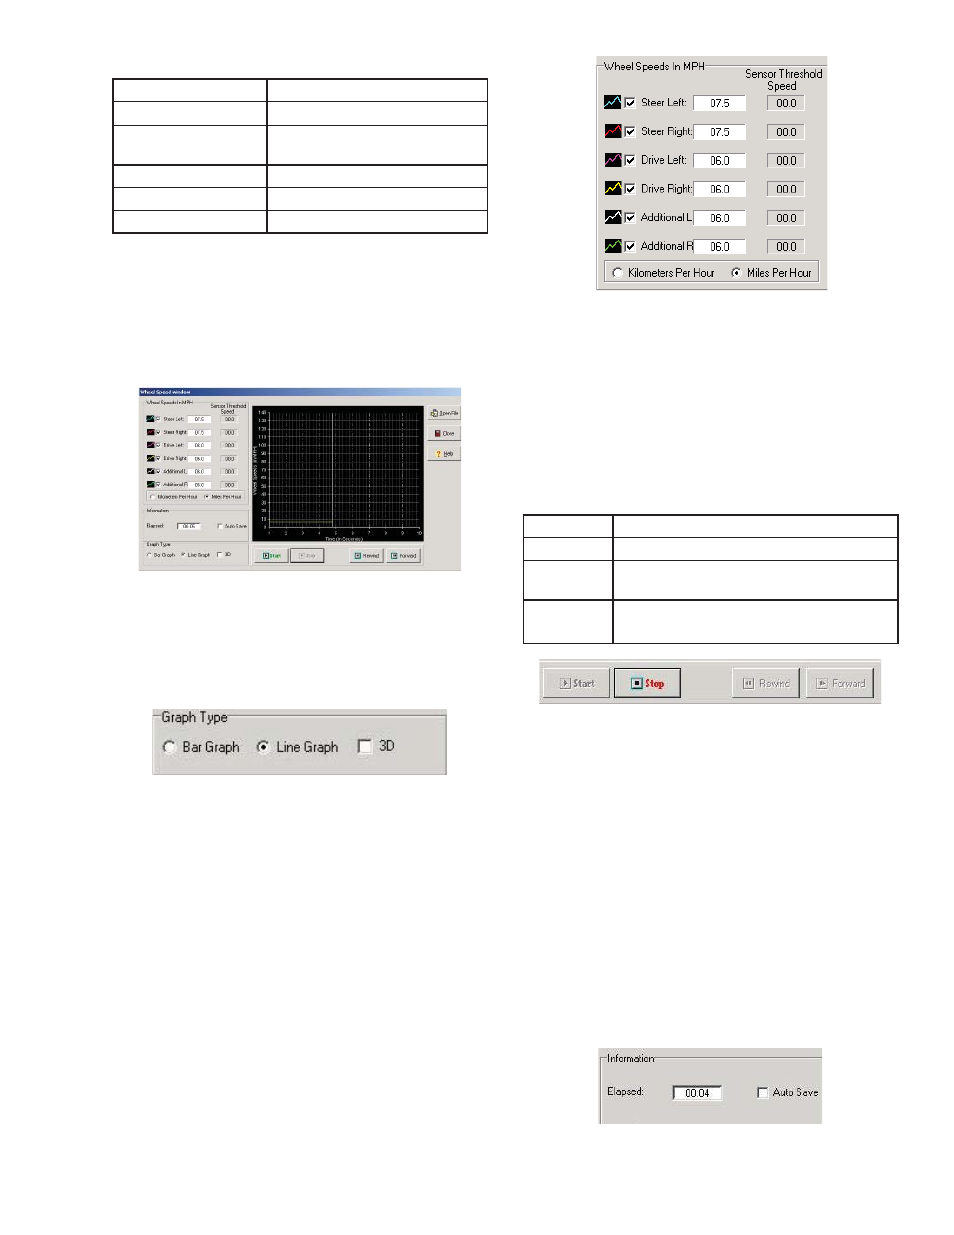
Numeric Display of Data
The number of wheels displayed in each graph is
confi gurable. Notice the “wheel speeds in MPH”
region of the screen has check boxes. If the boxes
are checked, the data for that wheel speed will be
displayed. In order to remove a particular wheel from
the graph screen; simply uncheck the box beside its
name.
Each wheel speed is displayed in the same color as
shown in the wheel speed box.
Also the user can select between miles per hour
and kilometer per hour by selecting the correct radio
button.
The value displayed under the wording of Sensor
Threshold speed indicates the strength of the sensor
signal in relationship to the sensor gap.
Figure 39
Data Acquisition of Wheel Speeds
It is possible to log data collected by the wheel speed
screen and save it to a comma delimited fi le. Before
attempting this, please ensure that settings such as
units and graph type are set to their desired settings,
as they can not be changed once data logging has
begun.
Data Acquisition Control Buttons
Start
Begins data logging
Stop
Ends data logging session
Rewind
Allows user to move backwards in time
through the data
Forward
Allows user to move forward in time
through the data
Figure 40
Information
The “elapsed” fi eld of this region refers to the elapsed
time of the current data logging session. In other
words, how long data has been recording, since the
start button was pressed. If the “auto save” check box
is selected before the data logging procedure begins,
the user will be immediately prompted to enter a fi le
name. When the stop button is pressed at the end of
a data logging session, the data will automatically be
saved to the fi le that was created by the user. Each
subsequent data trace will be saved under an auto-
incremented fi le name with no further input from the
user. If the “auto save” checkbox is not selected, the
user will be prompted to enter a fi le name, if they wish
to save the data they have recorded as the result of a
data logging session.
Figure 41