Driveobserver, Software reference card, Menus and commands – Rockwell Automation 9303 DriveTools Software Reference Card User Manual
Page 3: Driveobserver interface, Version 4.01
DriveObserver
™
SOFTWARE
REFERENCE CARD
1
2
3
8
9
7
7
6
5
4
MENUS AND COMMANDS
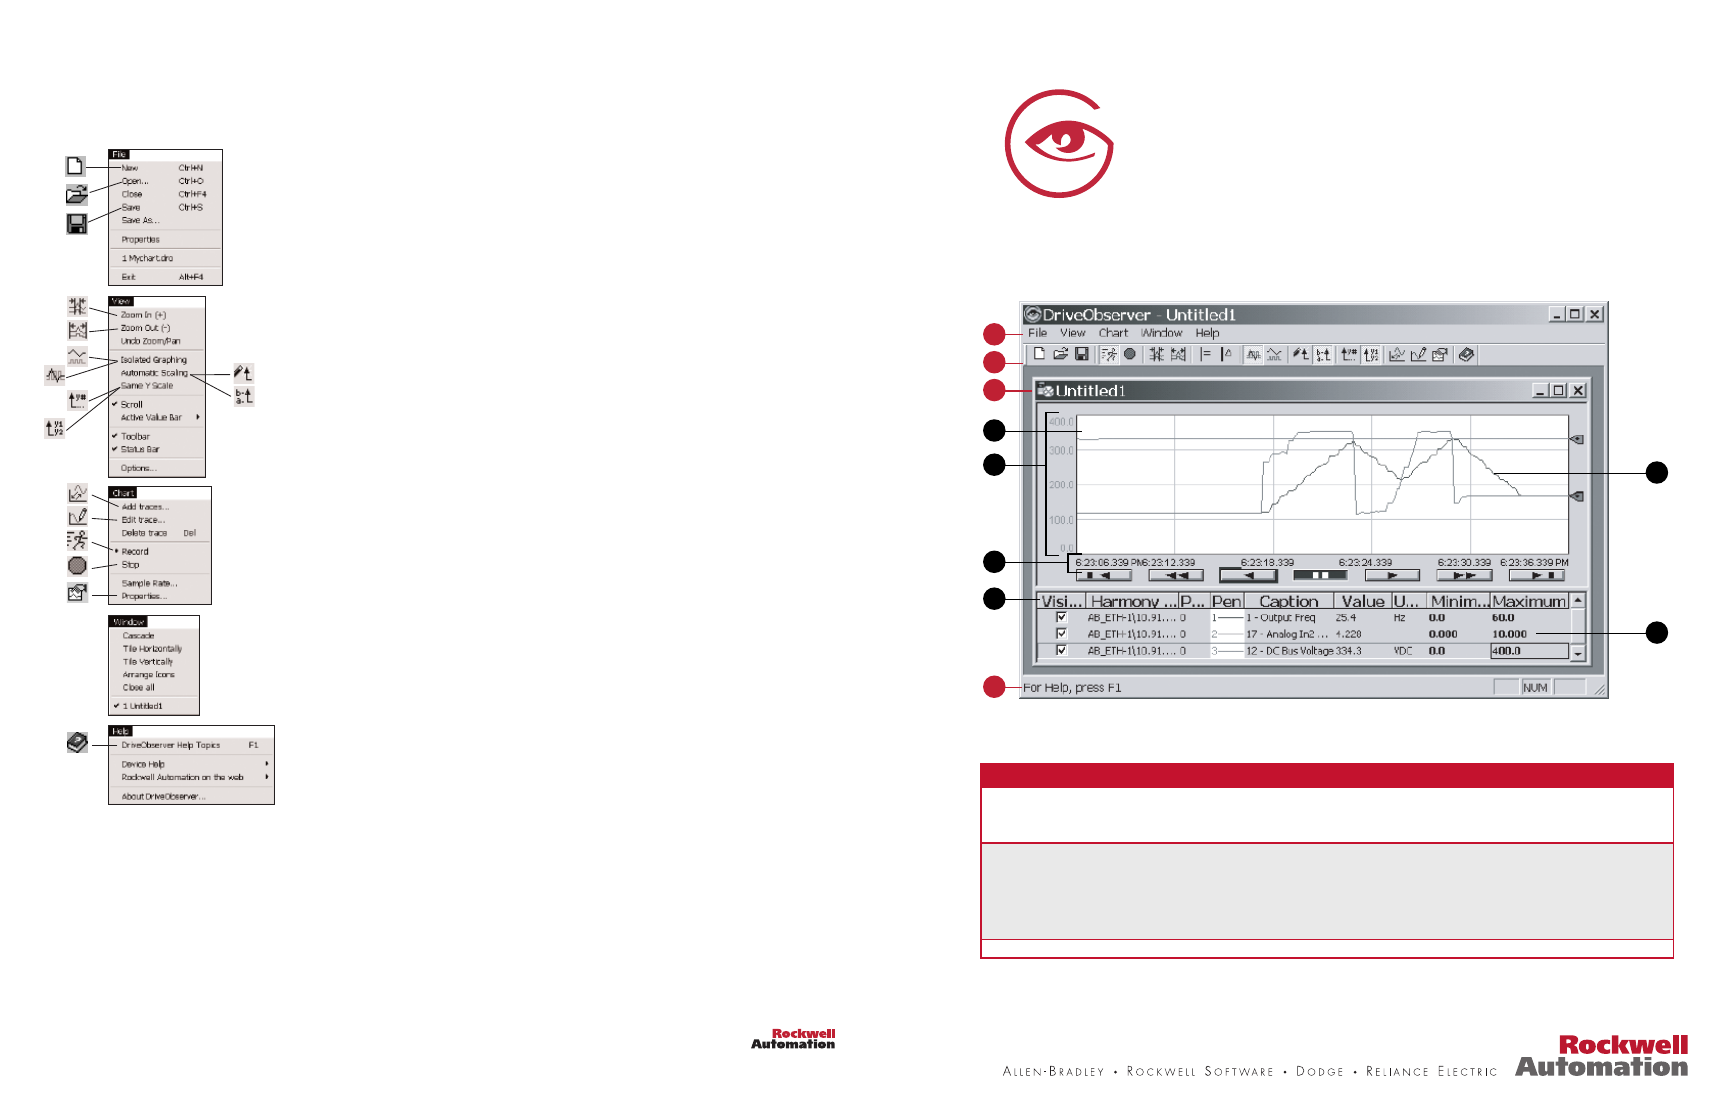
DriveObserver INTERFACE
DriveObserver contains the following menus and commands:
With commands in the
File menu, you can perform these tasks:
• Create a new chart
• Open an existing chart to view data or to use its configuration for
collection new data
• Save a chart, save chart data to a *.csv file
With commands in the
View menu, you can perform these tasks:
• Zoom In/Out on the time scale
• Overlap or isolate Y-axis scaling
• Use the time and value bars
• Turn the toolbar and status bar on and off
• Customize the view options to user preferences
With commands in the
Chart menu, you can perform these tasks:
• Add and remove traces (also add non-recorded traces such as gains for easy edits)
• Edit trace formatting (line type, markers, color)
• Start and stop real-time data collection
• View and edit Sample Rate and Chart Properties
With commands in the
Window menu, you can perform these tasks:
• Open a new window
• Arrange windows
• Switch between open windows
With commands in the
Help menu, you can perform these tasks:
• Display the DriveObserver online help
• Connect to DriveTools SP’s Internet site
• Display version and component information about DriveObserver
• View device help files
Important: Click a plus sign to expand a branch. Click a minus sign to close a branch.
Note: Software installation instructions can be found in the DriveExecutive Software and Reference Card.
Number
Name
Description
1
Menus
Contains the commands that you use to perform tasks. For example, you can select File>New to create a new chart.
2
Tool Bar
The tool bar contains shortcuts to several commonly used commands.
3
Chart Window
Displays information about the traces you are monitoring and the real-time data that has been collected.
4
Chart
The chart is where you will view a graphical display of the collected data.
5
Y-Axis
The trace scaling information.
6
X-Axis
The time axis.
7
Trace
A parameter for which you are collecting data.
8
Table View
Displays information about the traces that you are monitoring with in-place editing of min/max while running. Also provides node status (running,
faulted, not communicating, etc.)
9
Status Bar
The status bar provides brief descriptions.
PN DTS.01ENE03
6400 W. Enterprise Drive
Mequon, WI 53092
VERSION 4.01