Cs5581 – Cirrus Logic CS5581 User Manual
Page 21
CS5581
DS796PP1
21
3/25/08
14:34
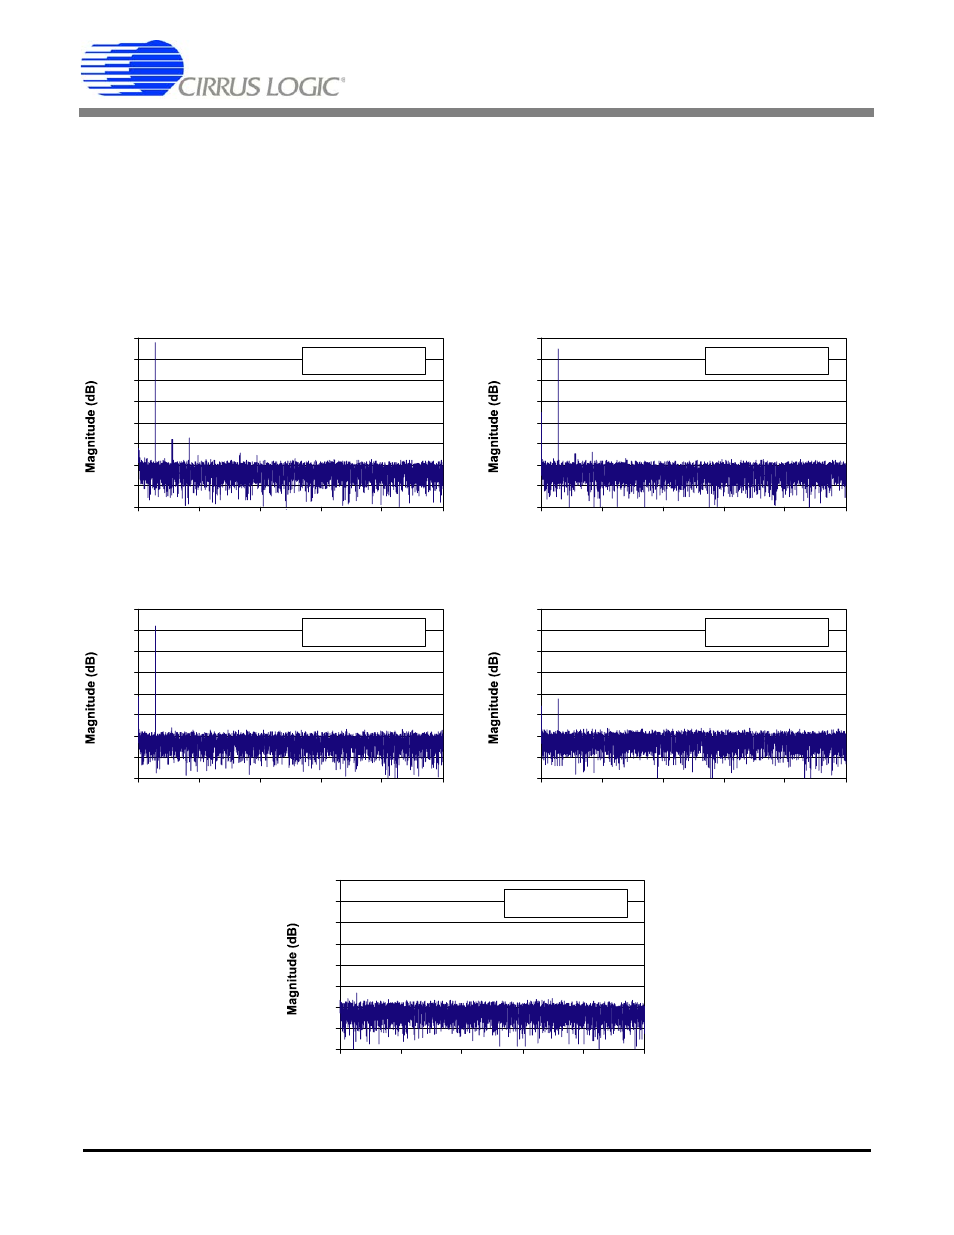
Figures 11 through 16 illustrate the performance of the CS5581 when driven by a 5.55 kHz sine wave at
various amplitudes. In each case, the captured data was windowed with a seven-term window function
that exhibits 4.3 dB of attenuation before being processed by the FFT.
Figure 14 illustrates the converter performance with an input that is 1/10,000 of full scale. This is a signal
magnitude of about 6.5 codes, peak to peak.
Figure 15 illustrates the converter performance with an input that is 1/100,000 of full scale, or about 0.65
of a code, peak to peak. These plots illustrate that this converter has excellent small-signal performance
due to the near-perfect DNL of the converter.
-160
-140
-120
-100
-80
-60
-40
-20
0
0
20k
40k
60k
80k
100k
Frequency (Hz)
5.55 kHz, 0 dB
32k Samples @ 200 kSps
-160
-140
-120
-100
-80
-60
-40
-20
0
0
20k
40k
60k
80k
100k
Frequency (Hz)
5.55 kHz, -6 dB
32k Samples @ 200 kSps
-160
-140
-120
-100
-80
-60
-40
-20
0
0
20k
40k
60k
80k
100k
Frequency (Hz)
5.55 kHz, -80 dB
32k Samples @ 200 kSps
-160
-140
-120
-100
-80
-60
-40
-20
0
0
20k
40k
60k
80k
100k
Frequency (Hz)
5.55 kHz, -12 dB
32k Samples @ 200 kSps
-160
-140
-120
-100
-80
-60
-40
-20
0
0
20k
40k
60k
80k
100k
Frequency (Hz)
5.55 kHz, -100 dB
32k Samples @ 200 kSps
Figure 11. Spectral Performance, 0 dB
Figure 12. Spectral Performance, -6 dB
Figure 13. Spectral Performance, -12 dB
Figure 14. Spectral Performance, -80 dB
Figure 15. Spectral Performance, -100 dB