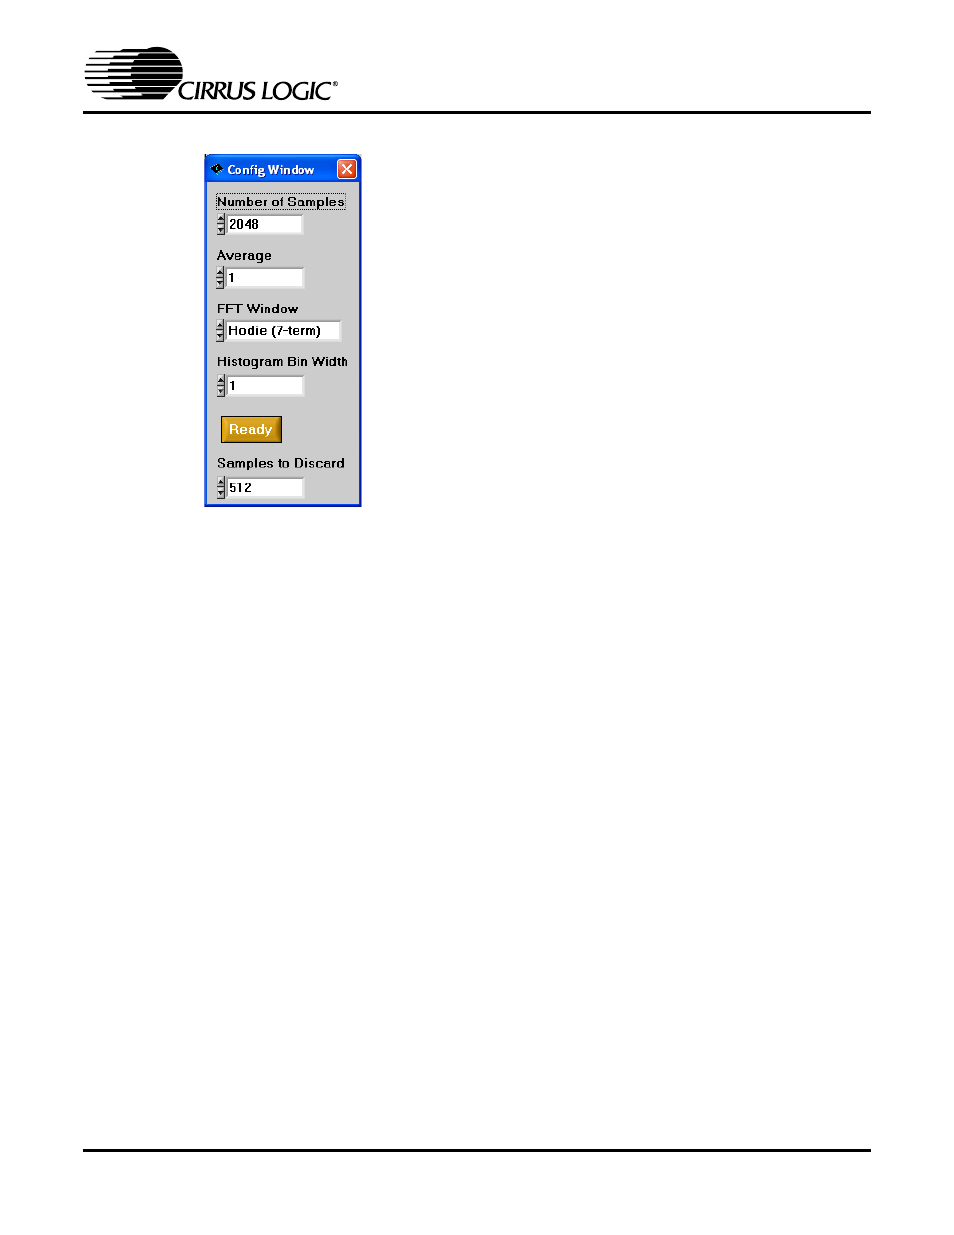
Figure 7. configuration window, Histogram bin width, Samples to discard – Cirrus Logic CDB5451A User Manual
Page 18: Ready button, Crystal (mhz), 6 analyzing data, 7 time domain information, Count, Magnitude, Maximum

CDB5451A
18
DS458DB3
3.2.5.4. Histogram Bin Width
This box allows for a variable “bin width” when plot-
ting histograms of the collected data. Each vertical
bar in the histogram plot will contain the number of
output codes contained in this box. Increasing this
number may allow the user to view histograms with
larger input ranges.
3.2.5.5. Samples to Discard
This number represents the number of CS5451A
sample periods that will be ignored before the soft-
ware starts to collect samples (when the user
presses on the Collect Button). After the software
has skipped over this many data samples, the soft-
ware will then begin to save samples from the de-
vice (for all six channels). The number of samples
that are actually saved is equal to the number
specified in the Number of Samples box.
3.2.5.6. Ready Button
After the user has adjusted the parameters in the
Config Window to the desired settings, the user
must click on the READY button to close the Con-
fig Window and return to the Data Collection Win-
dow.
3.2.5.7. Crystal (MHz)
This frequency value is used to properly perform
the FFT operation on a set of collected data. The
user can adjust this value. Default value is 4.096
(Mhz), which is the frequency of the crystal oscilla-
tor (U1) on the evaluation board.
3.2.6 Analyzing Data
The evaluation software provides three types of
analysis tests - Time Domain, Frequency Domain,
and Histogram. The Time Domain analysis pro-
cesses acquired conversions to produce a plot of
Output Code versus Conversion Sample Number.
The Frequency Domain analysis processes ac-
quired conversions to produce a magnitude versus
frequency plot using the Fast-Fourier transform
(results up to Fs/2 are calculated and displayed).
The Histogram analysis test processes acquired
conversions to produce a histogram plot. Statisti-
cal noise calculated are also calculated and dis-
played.
3.2.7 Time Domain Information
The following controls and indicators are associat-
ed with the Time Domain Analysis. Time domain
data can be plotted in the Data Collection Window
by setting the Time Domain / FFT / Histogram se-
lector to “Time Domain.”
3.2.7.1. Count
Displays current x-position of the cursor on the
time domain display.
3.2.7.2. Magnitude
Displays current y-value of the cursor on the time
domain display.
3.2.7.3. Maximum
Indicator for the maximum value of the collected
data set.
3.2.7.4. Minimum
Indicator for the minimum value of the collected
data set.
Figure 7. Configuration Window
