Analog performance plots, 1 headphone thd+n versus output power plots, Figures 21 – Cirrus Logic CS43L21 User Manual
Page 55
DS723F1
55
CS43L21
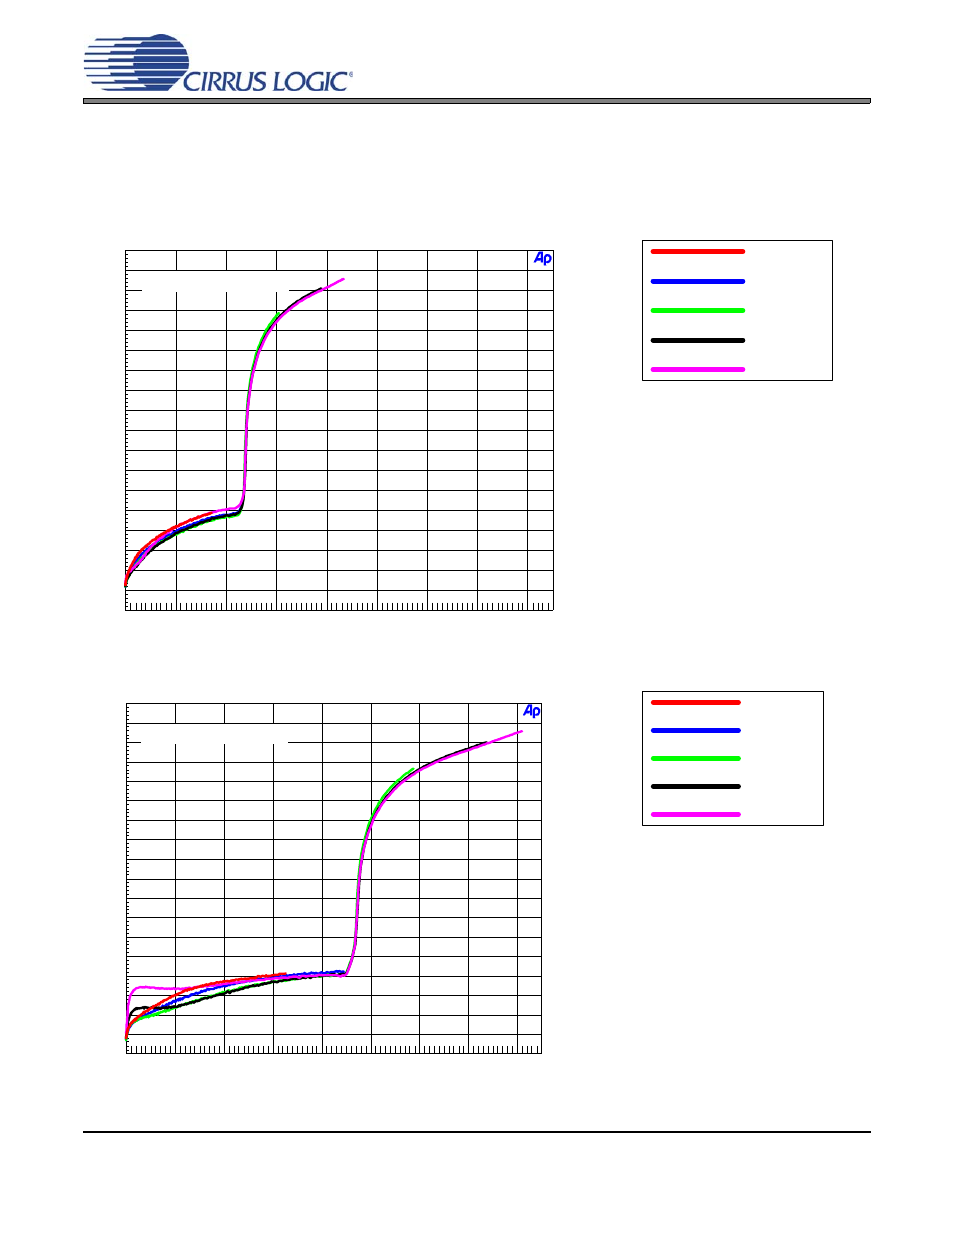
7. ANALOG PERFORMANCE PLOTS
7.1
Headphone THD+N versus Output Power Plots
Test conditions (unless otherwise specified): Input test signal is a 997 Hz sine wave; measurement band-
width is 10 Hz to 20 kHz; Fs = 48 kHz. Plots were taken from the CDB43L21 using an Audio Precision an-
alyzer.
G = 0.6047
G = 0.7099
G = 0.8399
G = 1.0000
G = 1.1430
Legend
-100
-10
-95
-90
-85
-80
-75
-70
-65
-60
-55
-50
-45
-40
-35
-30
-25
-20
-15
d
B
r
A
0
80m
10m
20m
30m
40m
50m
60m
70m
W
Figure 21. THD+N vs. Output Power per Channel at 1.8 V (16
load)
VA_HP = VA = 1.8 V
NOTE: Graph shows the out-
put power per channel (i.e.
Output Power = 23 mW into
single 16
and 46 mW into
stereo 16
with THD+N = -
75 dB).
G = 0.6047
G = 0.7099
G = 0.8399
G = 1.0000
G = 1.1430
Legend
-100
-10
-95
-90
-85
-80
-75
-70
-65
-60
-55
-50
-45
-40
-35
-30
-25
-20
-15
d
B
r
A
0
80m
10m
20m
30m
40m
50m
60m
70m
W
Figure 22. THD+N vs. Output Power per Channel at 2.5 V (16
load)
VA_HP = VA = 2.5 V
NOTE: Graph shows the out-
put power per channel (i.e.
Output Power = 44 mW into
single 16
and 88 mW into
stereo 16
with THD+N = -
75 dB).