Exploring the main screen – CatEye MSC Series Download Kit User Manual
Page 12
12
e-Train Data™
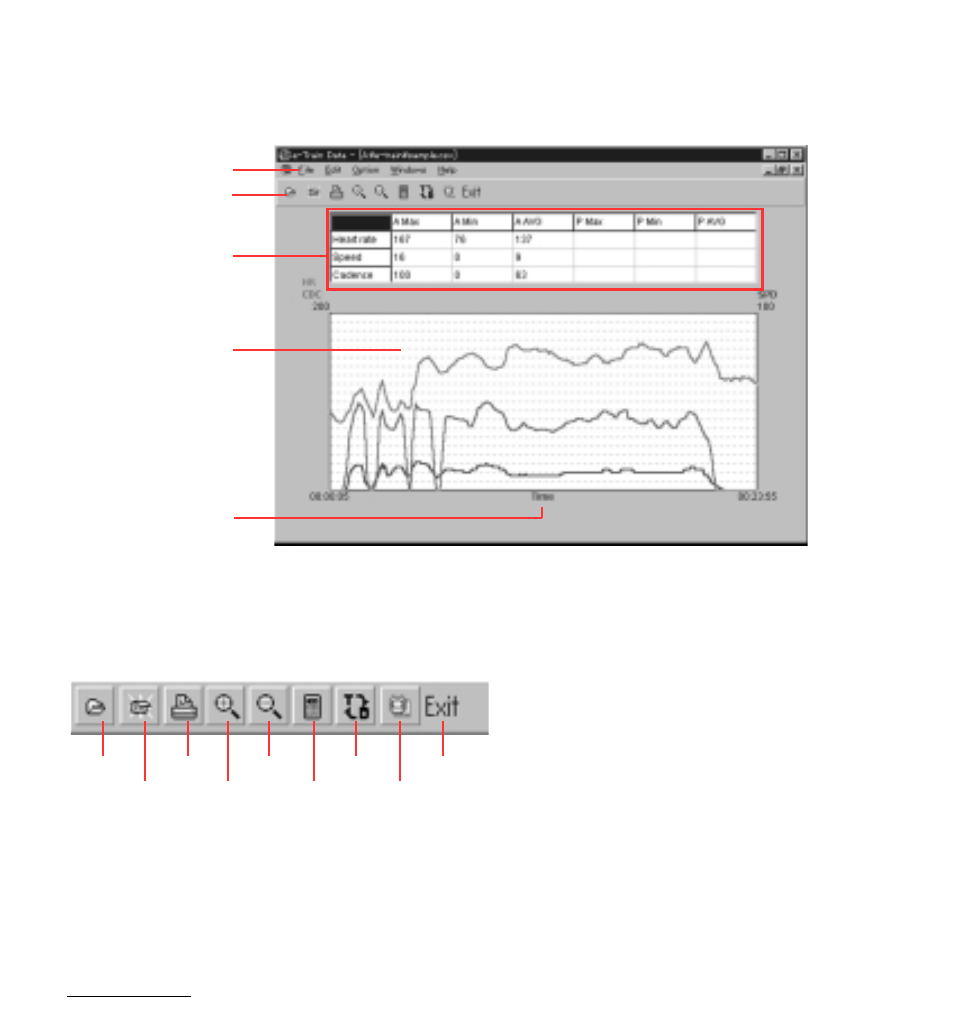
Exploring the main screen
The lower part is the line-graph of the entire data.
The upper part is the table showing the maximum, minimum and average of the displayed
graph.
• Menu Bar
Click each menu and the commands appear in the pull-down box.
• Toolbar
You can quickly execute the following commands with these buttons:
• Graph
Line-graph shows the data of speed (blue), cadence (green) and heartrate
(red). The horizontal axis can be changed between elapsed time and dis-
tance.
Menu Bar
Toolbar
Maximum, minimum and
average data
Speed (blue)
Cadence (green)
Heartrate (red)
Open File ------------- Opens an e-Train Data file
Close File ------------- Closes an e-Train Data file
Print -------------------- Opens the print dialogue box
Zoom ------------------ Zooms up the graph
Undo ------------------- Restores the graph to the previous size
Analysis --------------- Displays the data of the selected interval
Change --------------- Changes the horizontal axis between elapsed
time and distance
Download ------------- Opens the download dialogue box
Exit --------------------- Finishes e-Train Data file
Open File
Undo
Change
Exit
Close File
Zoom
Analysis
Download
Elapsed time (or distance)