3 performance list, Performance test report – AMD Socket AM2+ Quad Core Processor 790GX User Manual
Page 9
4
1-3
Performance
List
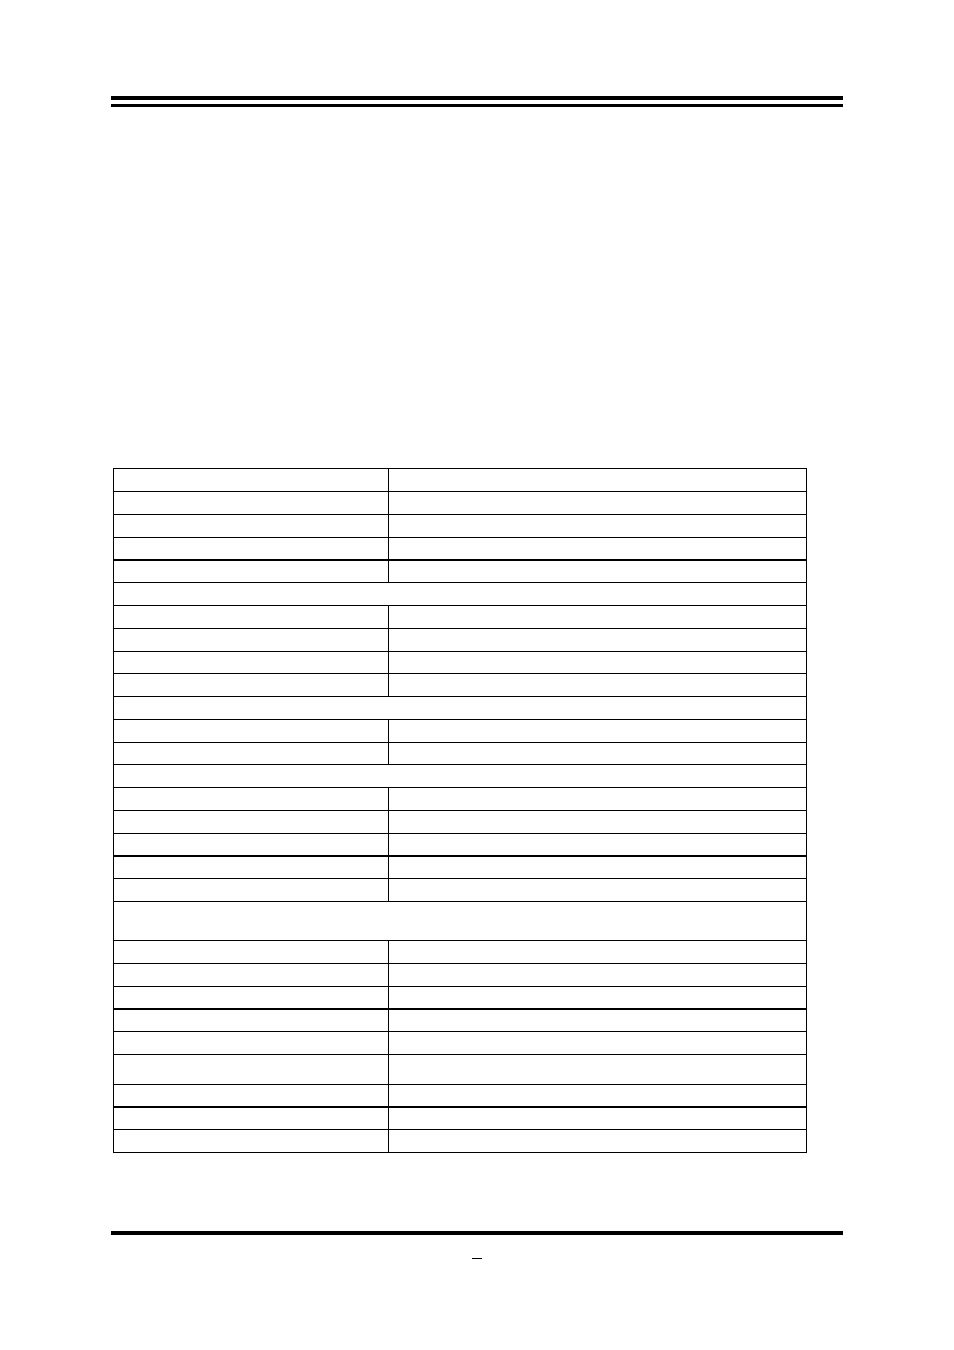
The following performance data list is the testing result of some popular benchmark testing
programs. These data are just referred by users, and there is no responsibility for different
testing data values gotten by users (the different Hardware & Software configuration will
result in different benchmark testing results.)
Performance Test Report
CPU:
Athlon
5000+
DRAM:
SamSun 667MHz 1*2
VGA Card: onboard
Hard Disk Driver: Seagate160GB SATA
BIOS:
T01
OS:
Windows XP Professional (SERVICE PACK 2)
AMD 790GX
3D Mark 2001SE
10814
3D Mark 2003
3589
3D Mark 2005
2797
AQUAMRK3
4146
PCMark2004
System / CPU / Memory
4283/5232/3281
Graph / HDD
2029/4977
Content Creation Winstone 2004
37.4
Business Winstone 2004
28.3
Winbench 99 V2.0:
Business/Hi-end Disk Winmark99
20070023
Business/Hi-end Graphic Winmark
N/A
SYSMark 2004: SISMark Rating(Internet Content Creation / Office Productivity )
SYSMark 2004
332/194
3D Creation/2D Creation
297/399
Web publication
309
Communication/Document Creation
167/233
DATA Analysis
188
SISOFT Sandra 2007 : 1.CPU Arithmetic Benchmark 2.Memory bandwidth Benchmark 3.CPU
Multi-Media Benchmark ver:1140
1. Dhrystone ALU
MIPS
18856
Whetstone FPU iSSE3
FLOPS
15937
2.Int/Float Buffered iSSE2
MB/S
6738/6691
3.Integer/Floating-Point IT/S
48962/53968
UT2003 Benchmark (flyby/botmatch)
158.51/84.602921
Quake3 DEMO1 /DEMO2
FPS
334.4/332.8
DOOM 3
FPS
N/A
Super Pi (1M)
Second
36.2611
CPUZ System / CPU Clock
26GHz