Campbell Scientific OBS-5+ Sediment Concentration Monitor and Pressure Sensor User Manual
Page 12
OBS-5+ System
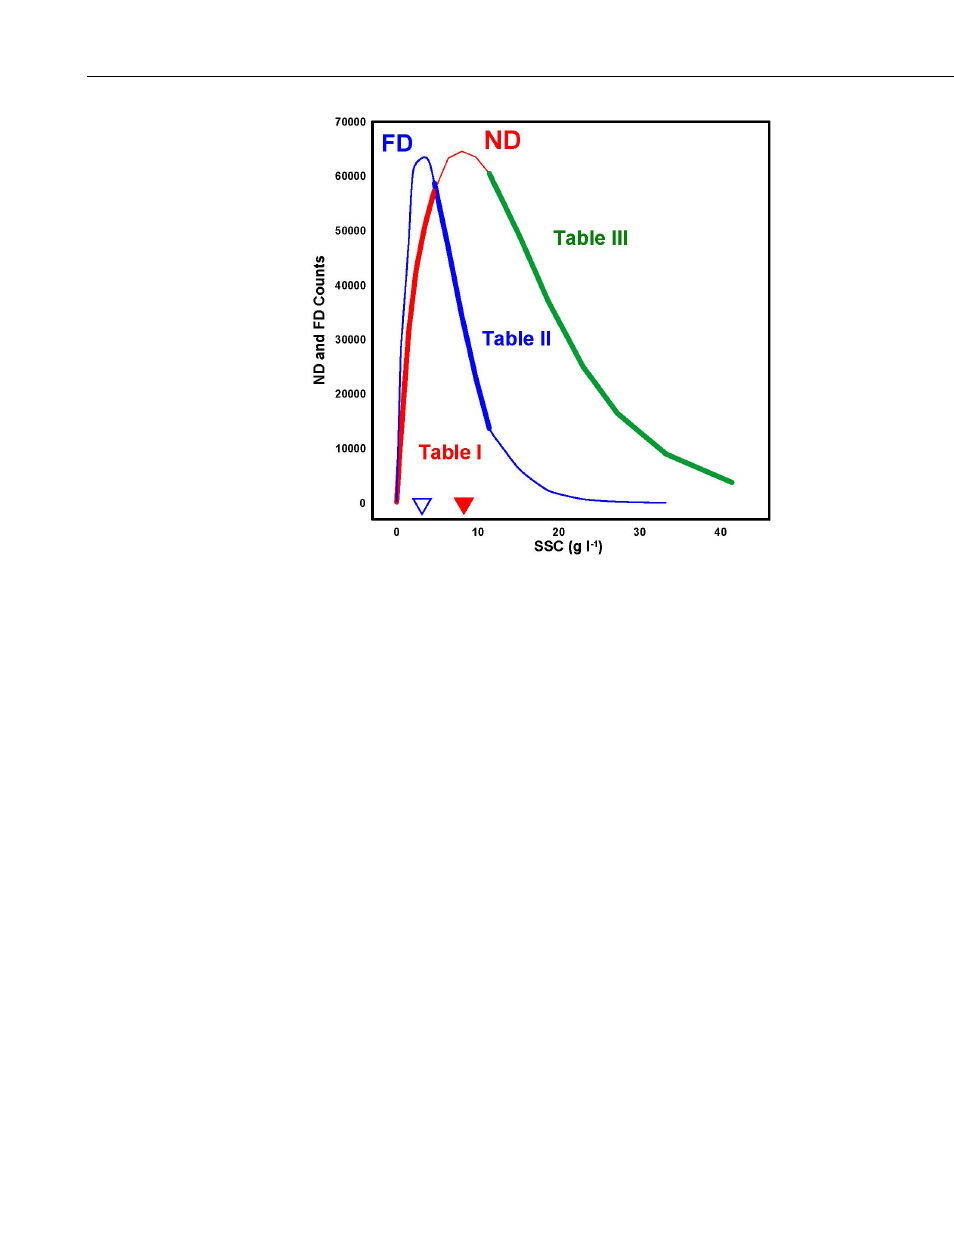
FIGURE 4-3. Sample calibration curves (fine and bold lines), lookup
tables I, II, and III (bold curves), and sediment concentrations pf ND
(open arrow) and FD (solid arrow) peaks.
The concentrations associated with the ND and FD peaks depend on sediment
characteristics as shown by the variety of response curves and the colored
arrowheads on FIGURE 4-4. Other sediment characteristics being equal, such
as shape and NIR reflectivity (see Section 10, Interfering Factors), larger
particles produce higher peak concentrations and greater OBS-5+ measurement
ranges than smaller particles.
4
See also other documents in the category Campbell Scientific Measuring instruments:
- 014A Met One Wind Speed Sensor (36 pages)
- 020C Wind Direction Sensor (26 pages)
- 024A-L Met One Wind Direction Sensor (30 pages)
- 03001-L R.M. Young Wind Sentry Set (34 pages)
- 03002, 03101, and 03301 R. M. Young Wind Sentry Sensors (40 pages)
- 034A-L WindSet (16 pages)
- 034B-L Met One Windset (34 pages)
- 036, 038 Spark Gapped Junction Box (6 pages)
- 05103, 05103-45, 05106, and 05305 R. M. Young Wind Monitors (30 pages)
- 083E Relative Humidity and Temperature Sensor (22 pages)
- 0871LH1 Freezing Rain Sensor (31 pages)
- 092 Barometric Pressure Sensor (24 pages)
- 10164-L Water Sampler Control Cable for use with Isco and Sigma Autosamplers (18 pages)
- 107-L Temperature Probe (28 pages)
- 108-LC Temperature Probe for MetData1 (12 pages)
- 108-L Temperature Probe (30 pages)
- 109-L Temperature Probe (30 pages)
- 109SS Temperature Probe (32 pages)
- 110PV Surface Temperature Probe (32 pages)
- 21108 RF450 Demo Kit (14 pages)
- 223-L Delmhorst Cylindrical Soil Moisture Block (28 pages)
- 227-L Delmhorst Cylindrical Soil Moisture Block (24 pages)
- 229 Water Matric Potential Sensor and CE4/CE8 (34 pages)
- 237-L Leaf Wetness Sensor (14 pages)
- 247-L Conductivity and Temperature (18 pages)
- 253-L and 257-L (Watermark 200) Soil Matric Potential Sensors (36 pages)
- 25458 DIN-Rail Terminal Kit (10 pages)
- 255-100 Novalynx Analog Output Evaporation Gauge (16 pages)
- 260-953 Alter-Type Wind Screen for Tipping Bucket Rain Gages (14 pages)
- 27106T Gill Propeller Anemometer (18 pages)
- 30066 Battery Terminal Bus (1 page)
- 380, 385, 380M, 385M Met One Rain Gages (22 pages)
- 3WHB10K 3-Wire Half-Bridge Terminal Input Module (14 pages)
- 43347 RTD Temperature Probe and 43502 Aspirated Radiation Shield (40 pages)
- 4386 Battery Terminal Bus (1 page)
- 4WFB120, 4WFB350, 4WFB1K 4-Wire Full Bridge Terminal Input Module (22 pages)
- 4WFBS120, 4WFBS350, 4WFBS1K 4 Wire Full Bridge Terminal Input Modules (46 pages)
- 4WPB100, 4WPB1K PRT Terminal Input Modules (16 pages)
- 52202 Electrically Heated Rain and Snow Gage (16 pages)
- 9522B Iridium Satellite Modem and COM9522B Interface Modem (46 pages)
- A100LK Anemometer (18 pages)
- A150 Desiccated Case (12 pages)
- A21REL-12 Relay Driver (10 pages)
- A6REL-12 Relay Driver (12 pages)
- AL200 ALERT2 Encoder, Modulator, and Sensor Interface (44 pages)