2 ssc-measurement principle, Ssc-measurement principle, 2. schematic of optical system – Campbell Scientific OBS-5+ Sediment Concentration Monitor and Pressure Sensor User Manual
Page 11
OBS-5+ System
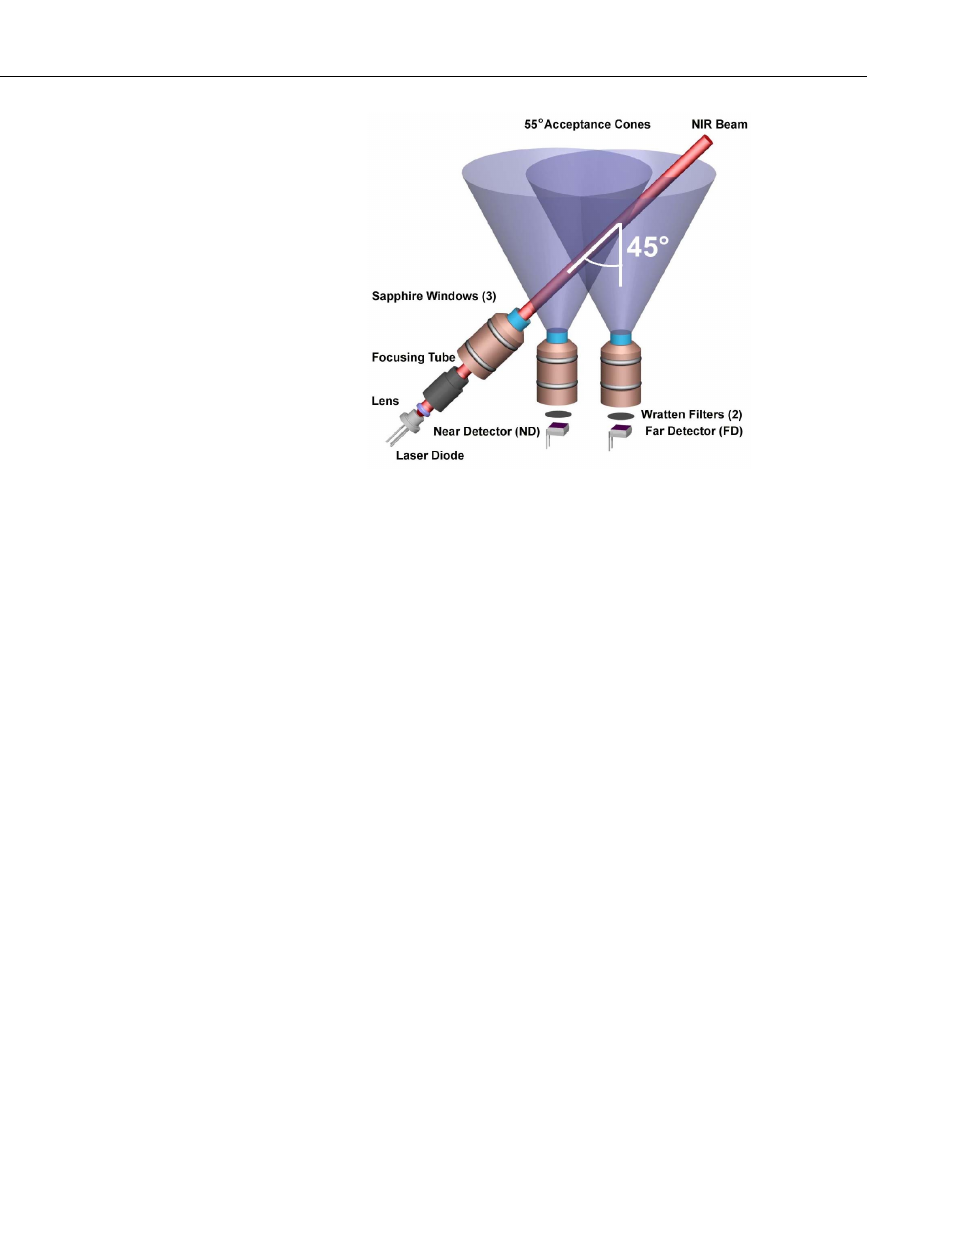
FIGURE 4-2. Schematic of optical system
4.2 SSC-Measurement Principle
In FIGURE 4-2, suspended particles scatter light from the NIR beam onto the
near and far detectors, and suspended solids concentration (SSC) is estimated
with signals counts from these detectors by a microcontroller, using a set of
logic rules and lookup tables derived from calibration data. Counts are the
digital equivalents of the ND and FD signals and are proportional to
backscatter intensity. Sample calibration curves relating ND and FD counts to
sediment concentration in g L
–1
are shown on FIGURE 4-3. As particle
concentration increases from 0, the ND and FD signals rise to maxima at peak
concentrations, shown by the red (open) and blue (solid) arrowheads above the
x axis. Beyond the peak sediment concentrations, light attenuation is the
dominant factor controlling the light level at the detectors, and so the ND and
FD counts decline. The scattered NIR must travel farther to be detected by the
FD than by the ND, and therefore the peak of the FD curve occurs at a lower
sediment concentration than the peak of the ND curve. The instrument exploits
these peak offsets to estimate sediment concentration. Using either the ND or
FD counts, whichever is indicated by the logic rules, the microcontroller does a
spline interpolation between calibration values to derive an SSC value. It then
combines this value with time and pressure data, and sends the results to a PC.
3