Operation, 1 sensor schematic, 2 measurement and output linearization – Campbell Scientific 109-L Temperature Probe User Manual
Page 18: Sensor schematic, Measurement and output linearization, 1. 109 thermistor probe schematic, N 8.2
Model 109 Temperature Probe
8. Operation
8.1 Sensor Schematic
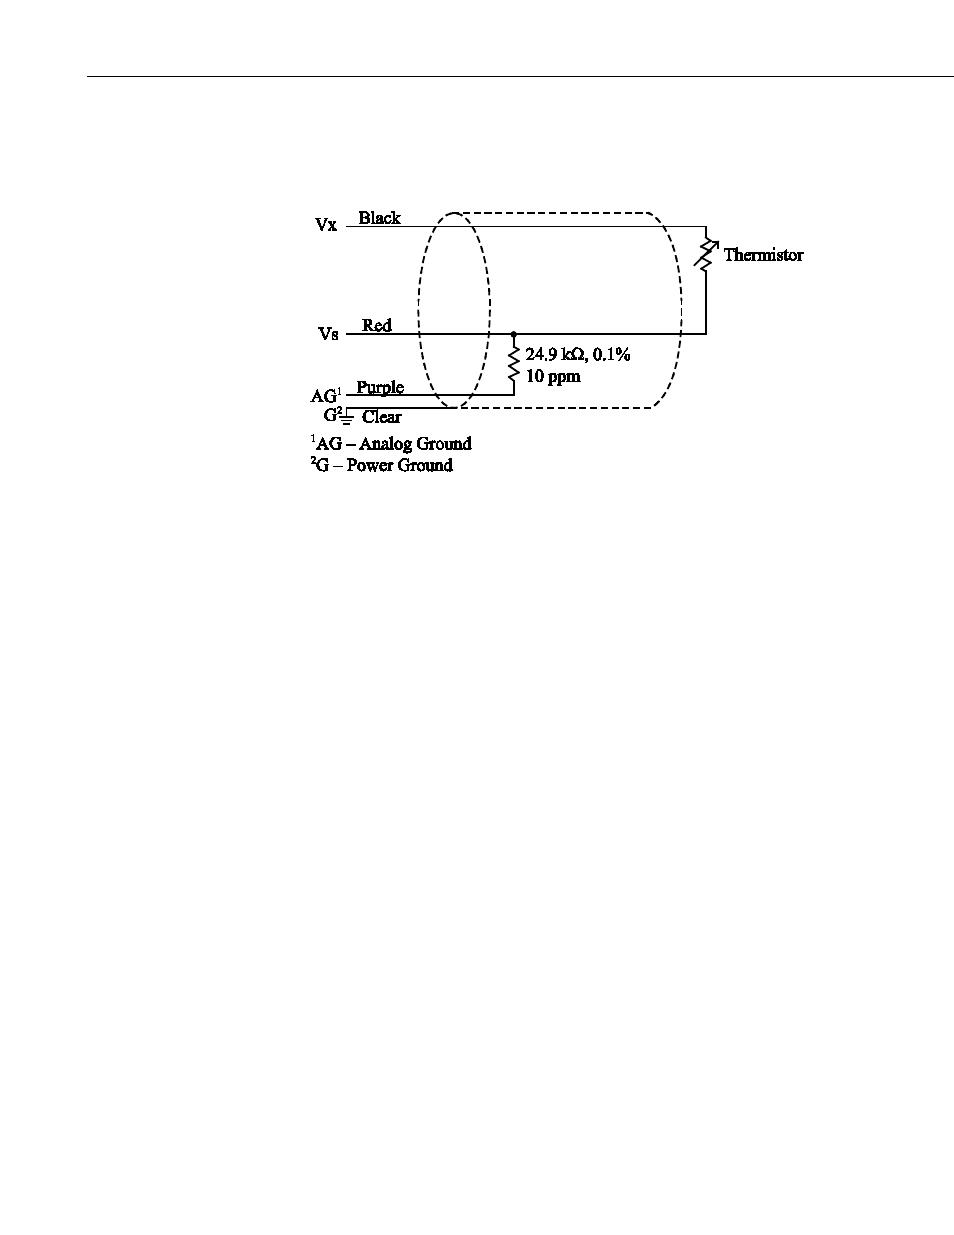
FIGURE 8-1. 109 Thermistor Probe Schematic
8.2 Measurement and Output Linearization
CRBasic instruction
Therm109() measures the 109 probe thermistor and
automatically converts the result to temperature. With reference to the
previous FIGURE 8-1, 109 thermistor probe schematic, a precise excitation
voltage is applied at the Vx line and the voltage drop across the 24.9 kΩ
resistor is measured at the Vs line.
The ratio of measured voltage (Vs) to excitation voltage (Vx) is related to
thermistor resistance (Rs) and the 24.9 kΩ bridge resistor as described in the
following equations:
Vs/Vx = 24900 Ω / (Rs + 24900 Ω)
Solving for Rs:
Rs + 24900 Ω = 24900 Ω • (Vx/Vs)
Rs = 24900 Ω • ((Vx/Vs) – 1)
The relationship of Rs to temperature is tabulated in Appendix C, Thermistor
Resistance and Temperature, but is calculated by
Therm109() using the
Steinhart-Hart equation, described as follows:
T = 1 / ((A + (B • ln(Rs))) + C • ((ln(Rs)))^3)) – 273.15
where:
T = temperature in Celsius
A
1
= 1.129241E–3
B
1
= 2.341077E–4
C
1
= 8.775468E–8
1
Coefficients provided by Measurement Specialties™.
10