Viewing disk array port traffic statistics, 28 traffic statistics about ports in a disk array – HP StorageWorks XP Remote Web Console Software User Manual
Page 47

Auto LUN XP user guide for the XP128/XP1024
47
4.
To display a graph, click the parity groups or logical volumes, use the list on the lower-right side of the
table to select the type of information you want to view, and click Draw. A graph displays below the
table. The horizontal axis indicates the time.
5.
To view detailed information in the graph, click the Detail check box on the lower-right side of the table,
and click Draw. The graph contents change. If you specify more than one parity group or logical
volume, you cannot click the Detail check box to view detailed information.
If the graph does not display changes in workload statistics, change the value in the Chart Y Axis Rate
list. For example, if the largest value in the table is 200 and the value in Chart Y Axis Rate is 100,
select a value larger than 200 from Chart Y Axis Rate.
The table displays the following:
•
Graph column: The check mark icon indicates the graph is currently illustrating data for that item.
•
Group: Parity group ID. If the ID starts with the letter E, logical volumes in the parity group are external
LUs.
•
LDEV: Logical volume ID. If the ID ends with the symbol #, logical volume is an external LU.
•
Type: Emulation type.
•
IO Rate (IOPS): Number of I/O requests to the parity group (or logical volume) per second. This column
is displayed when IOPS is selected in the list on the upper-right side of the table.
•
Read (IOPS): Number of read accesses to the parity group (or logical volume) per second. This column
is displayed when IOPS is selected in the list on the upper-right side of the table.
•
Write (IOPS): Number of write accesses to the parity group (or logical volume) per second. This column
is displayed when IOPS is selected in the list on the upper-right side of the table.
•
Trans.(MB/s): Size (in megabytes) of data transferred to the parity group (or logical volume) per
second. This column is displayed when MB/s is selected in the list on the upper-right side of the table.
•
Read Hit(%): Read hit rate.
•
Write Hit(%): Write hit rate.
•
Back Trans.(count/sec): Number of data transfers between parity group (or logical volume) and cache
memory.
•
Response Time (ms): Time (in milliseconds) for replying from an external volume group when I/O
accesses are made from the disk array to the external volume group. Average response time in the
period specified for Monitoring Term is displayed.
•
CLPR: The number and name of the CLPR that corresponds to the parity group to which the logical
volume belongs, in the format CLPR number:CLPRname. For more information, see the
HP StorageWorks XP Disk/Cache Partition User Guide.
Viewing disk array port traffic statistics
1.
In the Auto LUN pane, click Port-LUN, and click the Subsystem folder in the tree. The Port-LUN tree lists
ports on the disk array. When you double-click a port, a list of host groups for the port appears. When
you double-click a host group, the LUN icon appears.
2.
To check the number of I/Os, click IOPS in the list on the right side of the pane. To check the amount of
data transferred, click MB/s. To view IOPS or amount of data in real time, select the Real Time option,
specify the number of collections to display, and click Apply.
3.
In the Port-LUN tree, do one of the following:
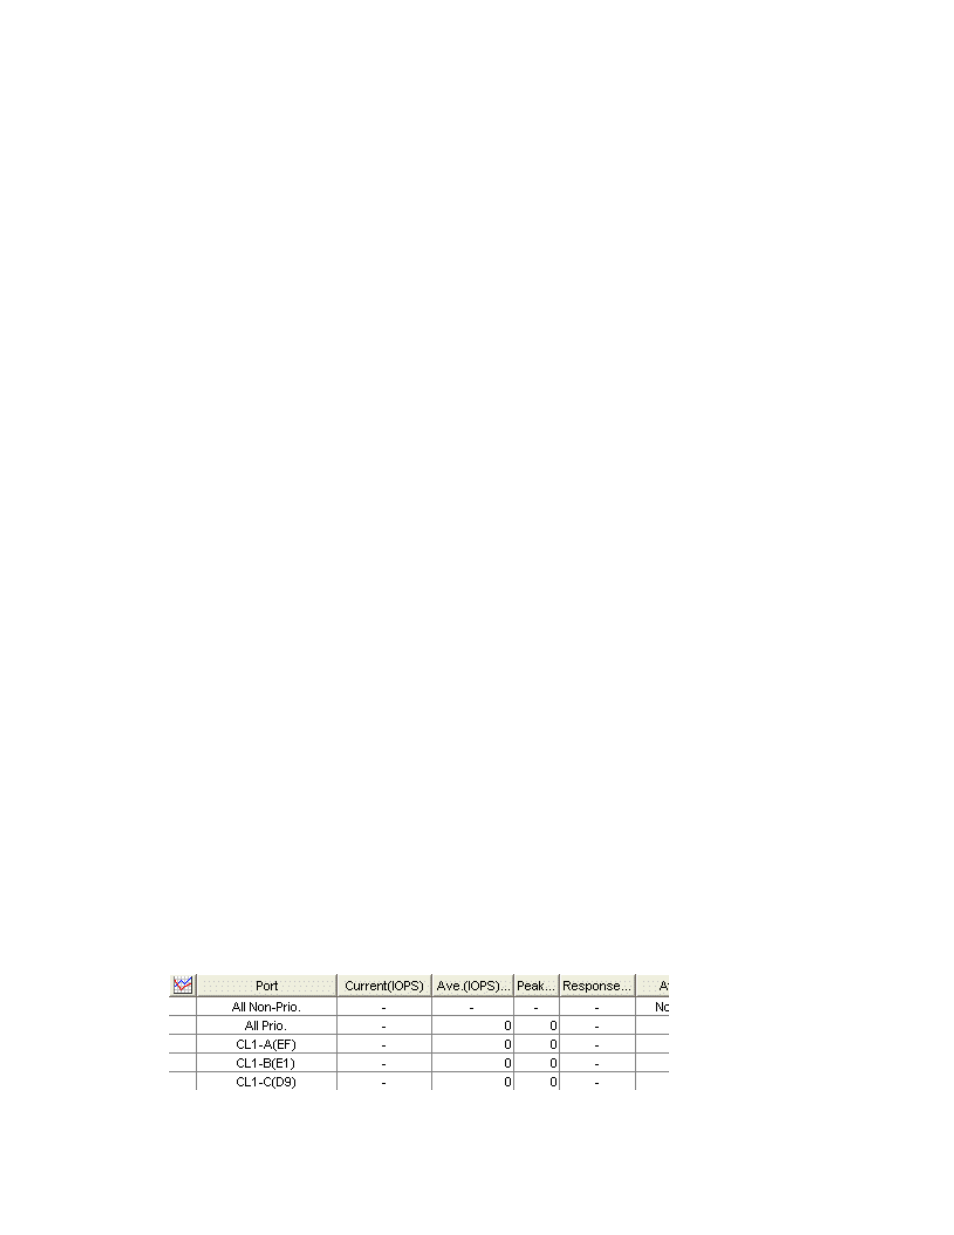
• To view traffic statistics about ports in the disk array, click the root.
Figure 28
Traffic statistics about ports in a disk array
