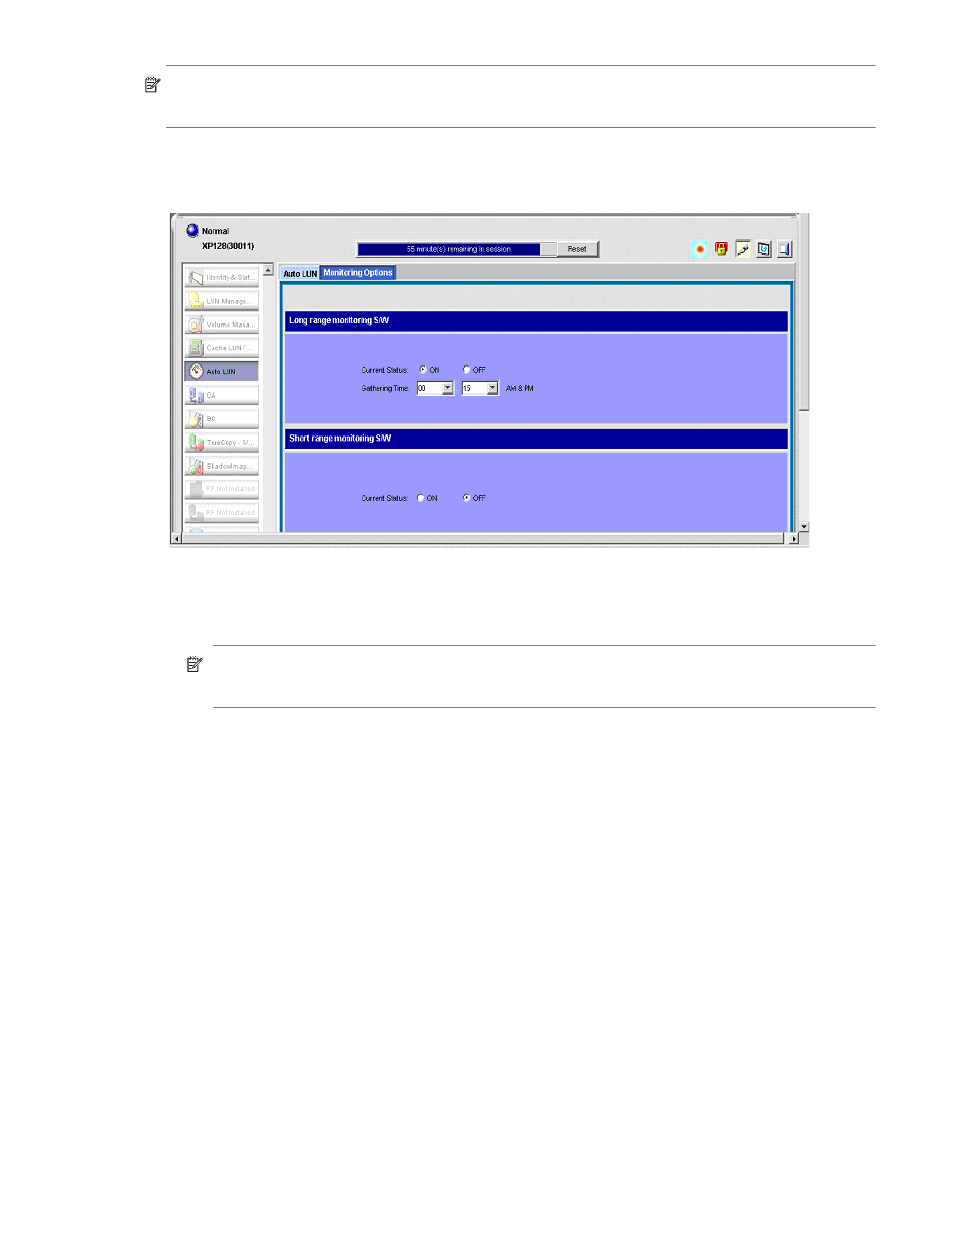
Xp128/xp1024 disk arrays, Figure 13 auto lun monitoring options pane, 13 auto lun monitoring options pane – HP StorageWorks XP Remote Web Console Software User Manual
Page 39

Auto LUN XP user guide for the XP128/XP1024
39
NOTE:
Settings in the Monitor Options pane work with settings for Continuous Access XP and Continuous
Access XP Journal. Therefore, changes you make to one pane affect the settings in the other panes.
XP128/XP1024 disk arrays
XP128/XP1024 arrays display the following pane:
:
Figure 13
Auto LUN Monitoring Options pane
This pane contains the following items:
•
Long range monitoring S/W: Monitors resources in the disk array to obtain usage statistics.
NOTE:
When you select long range, you cannot view the ratio of Business Copy XP and
ShadowImage for z/OS to all processing and usage statistics about cache memory.
• Current Status: Specifies whether the disk array is monitored. Click ON to start monitoring. Click
OFF to stop monitoring. The default is OFF.
• Gathering Time: Specifies when statistics are collected. If Current Status is ON, statistics are
collected at the time specified (once in the morning and once in the afternoon). The default is 0:00
(0:00 a.m. and 0:00 p.m.).
•
Short range monitoring S/W: Monitors disks, ports, and LU paths to obtain workload statistics, and
measures traffic between host bus adapters and ports.
• Current Status: Specifies whether the disk array is monitored. Click ON to start monitoring. Click
OFF to stop monitoring. The default is OFF.
If you click ON, the option setting automatically changes to OFF 24 hours later.
If the Physical tab is displayed and the monitoring term exceeds one day, data in the graph might be
subject to a margin of error. To display the graph correctly, ensure that the monitoring term does not
exceed one day. In the Physical tab, a maximum of 96 data points are plotted to form a single graph line.
Data point values can differ depending on whether the monitoring term exceeds one day.
If the LDEV or Port-LUN tab is displayed and the monitoring term exceeds 90 minutes, data in the graph
might be subject to a margin of error. To display the graph correctly, ensure that the monitoring term does
not exceed 90 minutes. In the LDEV or Port-LUN tab, a maximum of 90 data points are plotted to form a
single graph line. Data point values can differ depending on whether the monitoring term exceeds 90
minutes.
