Viewing disk adapter (dka) usage statistics, Figure 18 dka usage statistics, Viewing disk processor (dkp) usage statistics – HP StorageWorks XP Remote Web Console Software User Manual
Page 43: Figure 19 dkp usage statistics, 18 dka usage statistics, 19 dkp usage statistics
Auto LUN XP user guide for the XP128/XP1024
43
3.
To display a graph illustrating changes in usage rates for channel processors, click the channel
processors in the table, and click Draw.
The table displays the following items:
•
Graph column: The check mark icon indicates the graph is currently illustrating data for that item.
•
ID: Channel processor ID numbers.
•
Usage: The Ave. (Total) column displays the average usage rate in the specified period. The Max.
column displays the maximum usage rate in the specified period.
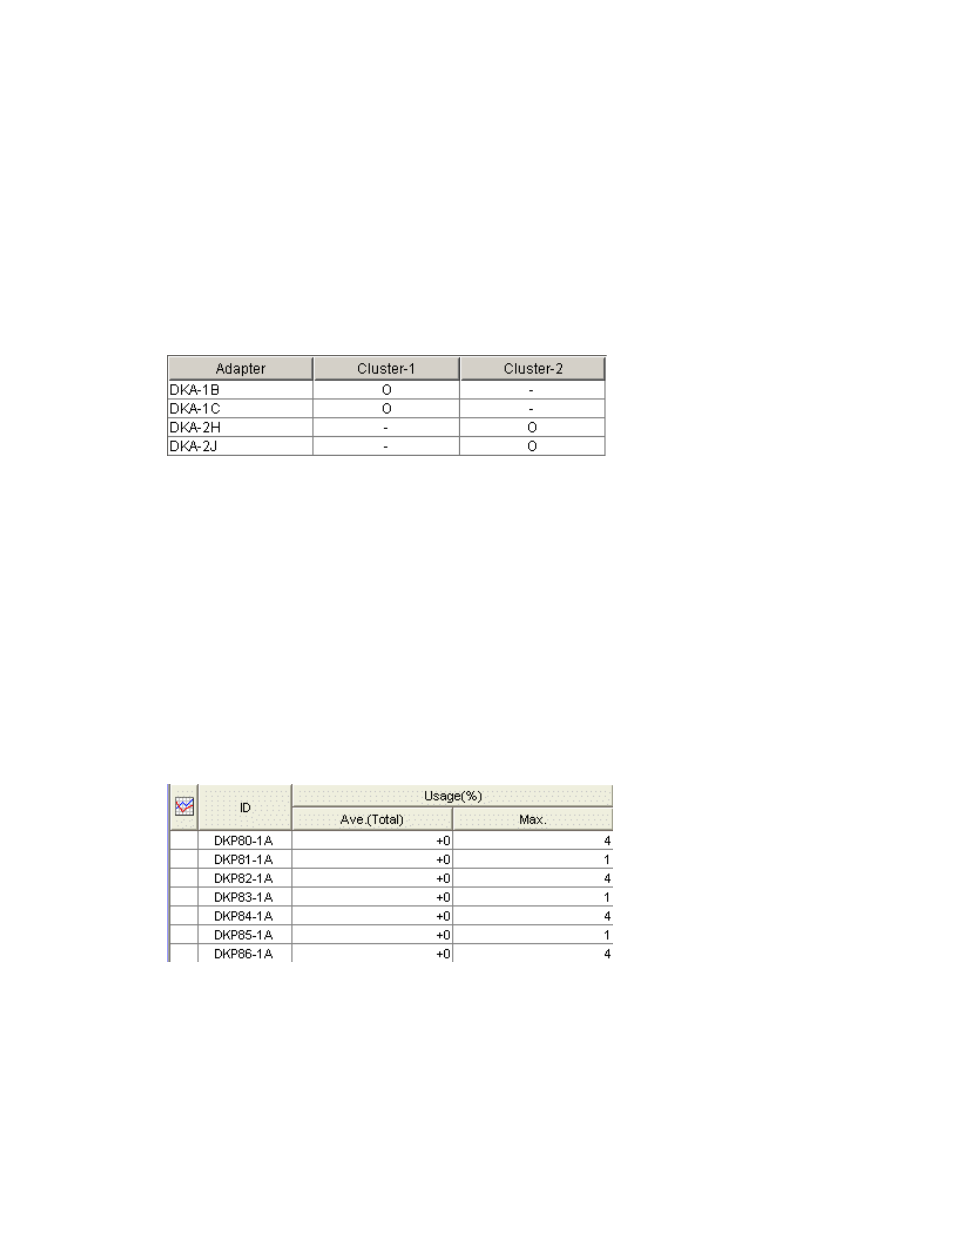
Viewing disk adapter (DKA) usage statistics
Auto LUN monitors disk adapters, and displays average and maximum usage rates in the specified period.
If you click the DKA folder, the table displays a list of disk adapters and indicates whether each disk
adapter is located in Cluster-1 or Cluster-2.
In the Auto LUN pane, click Physical, and click the DKA folder. The table displays a list of disk adapters.
Figure 18
DKA usage statistics
The table displays the following items:
•
Adapter: Disk adapter ID numbers.
•
Cluster-1: If the Cluster-1 column displays 0 and the Cluster-2 column displays a hyphen, the disk
adapter is located in Cluster-1.
•
Cluster-2: If the Cluster-2 column displays 0 and the Cluster-1 column displays a hyphen, the disk
adapter is located in Cluster-2.
Viewing disk processor (DKP) usage statistics
Auto LUN monitors disk processors, and displays average and maximum usage rates in the specified
period.
1.
In the Auto LUN pane, click Physical, and double-click the DKA folder. A list of disk processors appears
below the DKA folder.
2.
Click the DKP. The table displays usage statistics about disk processors in the disk adapter.
Figure 19
DKP usage statistics
3.
To display a graph illustrating changes in usage rates for disk processors, click the disk processors in
the table, and click Draw.
The table displays the following items:
•
Graph column: The check mark icon indicates the graph is currently illustrating data for that item.
•
ID: Disk processor ID numbers.
•
Usage: The Ave. (Total) column displays the average usage rate in the specified period. The Max.
column displays the maximum usage rate in the specified period.